

Market Minds Advisory
3PL Software Market

3PL Software Market: 3PL Software Market: Billing Accuracy, Multi-Client Architecture and Contract Economics 2026 to 2036

A third-party logistics operator runs on margins of three to five percent, which means a billing engine that misses accessorial charges destroys more value than any warehouse inefficiency ever could.

Lead Analyst

Published

September 2026

Make Smarter Decisions with Customized Research Insights

Request a free sample report and evaluate market opportunities, growth trends, and competitive dynamics relevant to your business needs.

2025 MARKET VALUE$4.6BMarket Size 2025
2036 FORECAST VALUE$13.7BBase Case , 2026 to 2036
CAGR 2026 TO 203610.4 %Bull 11.6% / Bear 9.2%
INCREMENTAL OPPORTUNITY$8.6BNet 10- year value creation
EXPANSION MULTIPLE2.69x2036 value over 2026 base
Strategic Levers
M&A Pipeline
Regional Outlook
Country Rankings
Competitive Intelligence
Segmental Deep-dive
Call-Us : 91 93563 13602

Executive Snapshot and Market Trajectory.

A third-party logistics operator works on net margins of roughly three to five percent, so an unbilled accessorial charge is not an inconvenience. It is the whole quarter. Software here is judged first on whether it captures every billable event, and only afterwards on anything else.
The market reaches USD 5.1 billion in 2026 and USD 13.7 billion by 2036, a 2.69 times expansion at 10.4% annually. Multi-client billing and contract management grows at 15.6%, half again the market rate of 10.4%, because 3PL contracts contain rate structures no general warehouse system was designed to handle. East Asia holds 26% of global spend, and Vietnam compounds fastest of any country at 16.8% on manufacturing relocation that keeps building new logistics capacity.
Five vendors hold just 37% of licence and subscription revenue, unusually low for enterprise software, because roughly 41% of 3PL operators still run systems written by their own internal teams. Manhattan Associates, Blue Yonder, Korber Supply Chain, SAP and Oracle lead the commercial part of the market between them. Replacement cycles run long, since a distribution centre simply cannot stop shipping while the system changes underneath it.
Market Definition
This report covers software licensed or subscribed by third-party logistics providers by application class: multi-client warehouse management, transportation management, multi-client billing and contract management, yard and dock scheduling, labour management and workforce planning, and visibility and customer portal platforms. It excludes software used by shippers managing their own logistics in-house, freight brokerage marketplaces, parcel carrier systems, physical automation control software, and enterprise resource planning suites.
Base Year Value
$4.6B in 2025 (MMA Primary Research Dataset, September 2026)
Forecast Period
2026 to 2036, eleven discrete annual values
CAGR
10.4% base case. Bull 11.6%. Bear 9.2%.
Fastest Growth Segment
Multi-Client Billing And Contract Management: 15.6% CAGR
Fastest Growth Country
Vietnam: 16.8% CAGR
Fastest Growth Region
South Asia and Pacific: 12.6% CAGR
Largest Region
East Asia: 26% of 2025 global value
Market Leaders
Manhattan Associates, Blue Yonder, Korber Supply Chain, SAP and Oracle lead on 3PL software licence and subscription revenue. Source: MMA Analysis.
Primary Survey
n=3,800 procurement and R&D decision-makers, Q4 2025, six countries
Methodology
Demand-side build-up, cross-validated against public data, 47 expert interviews

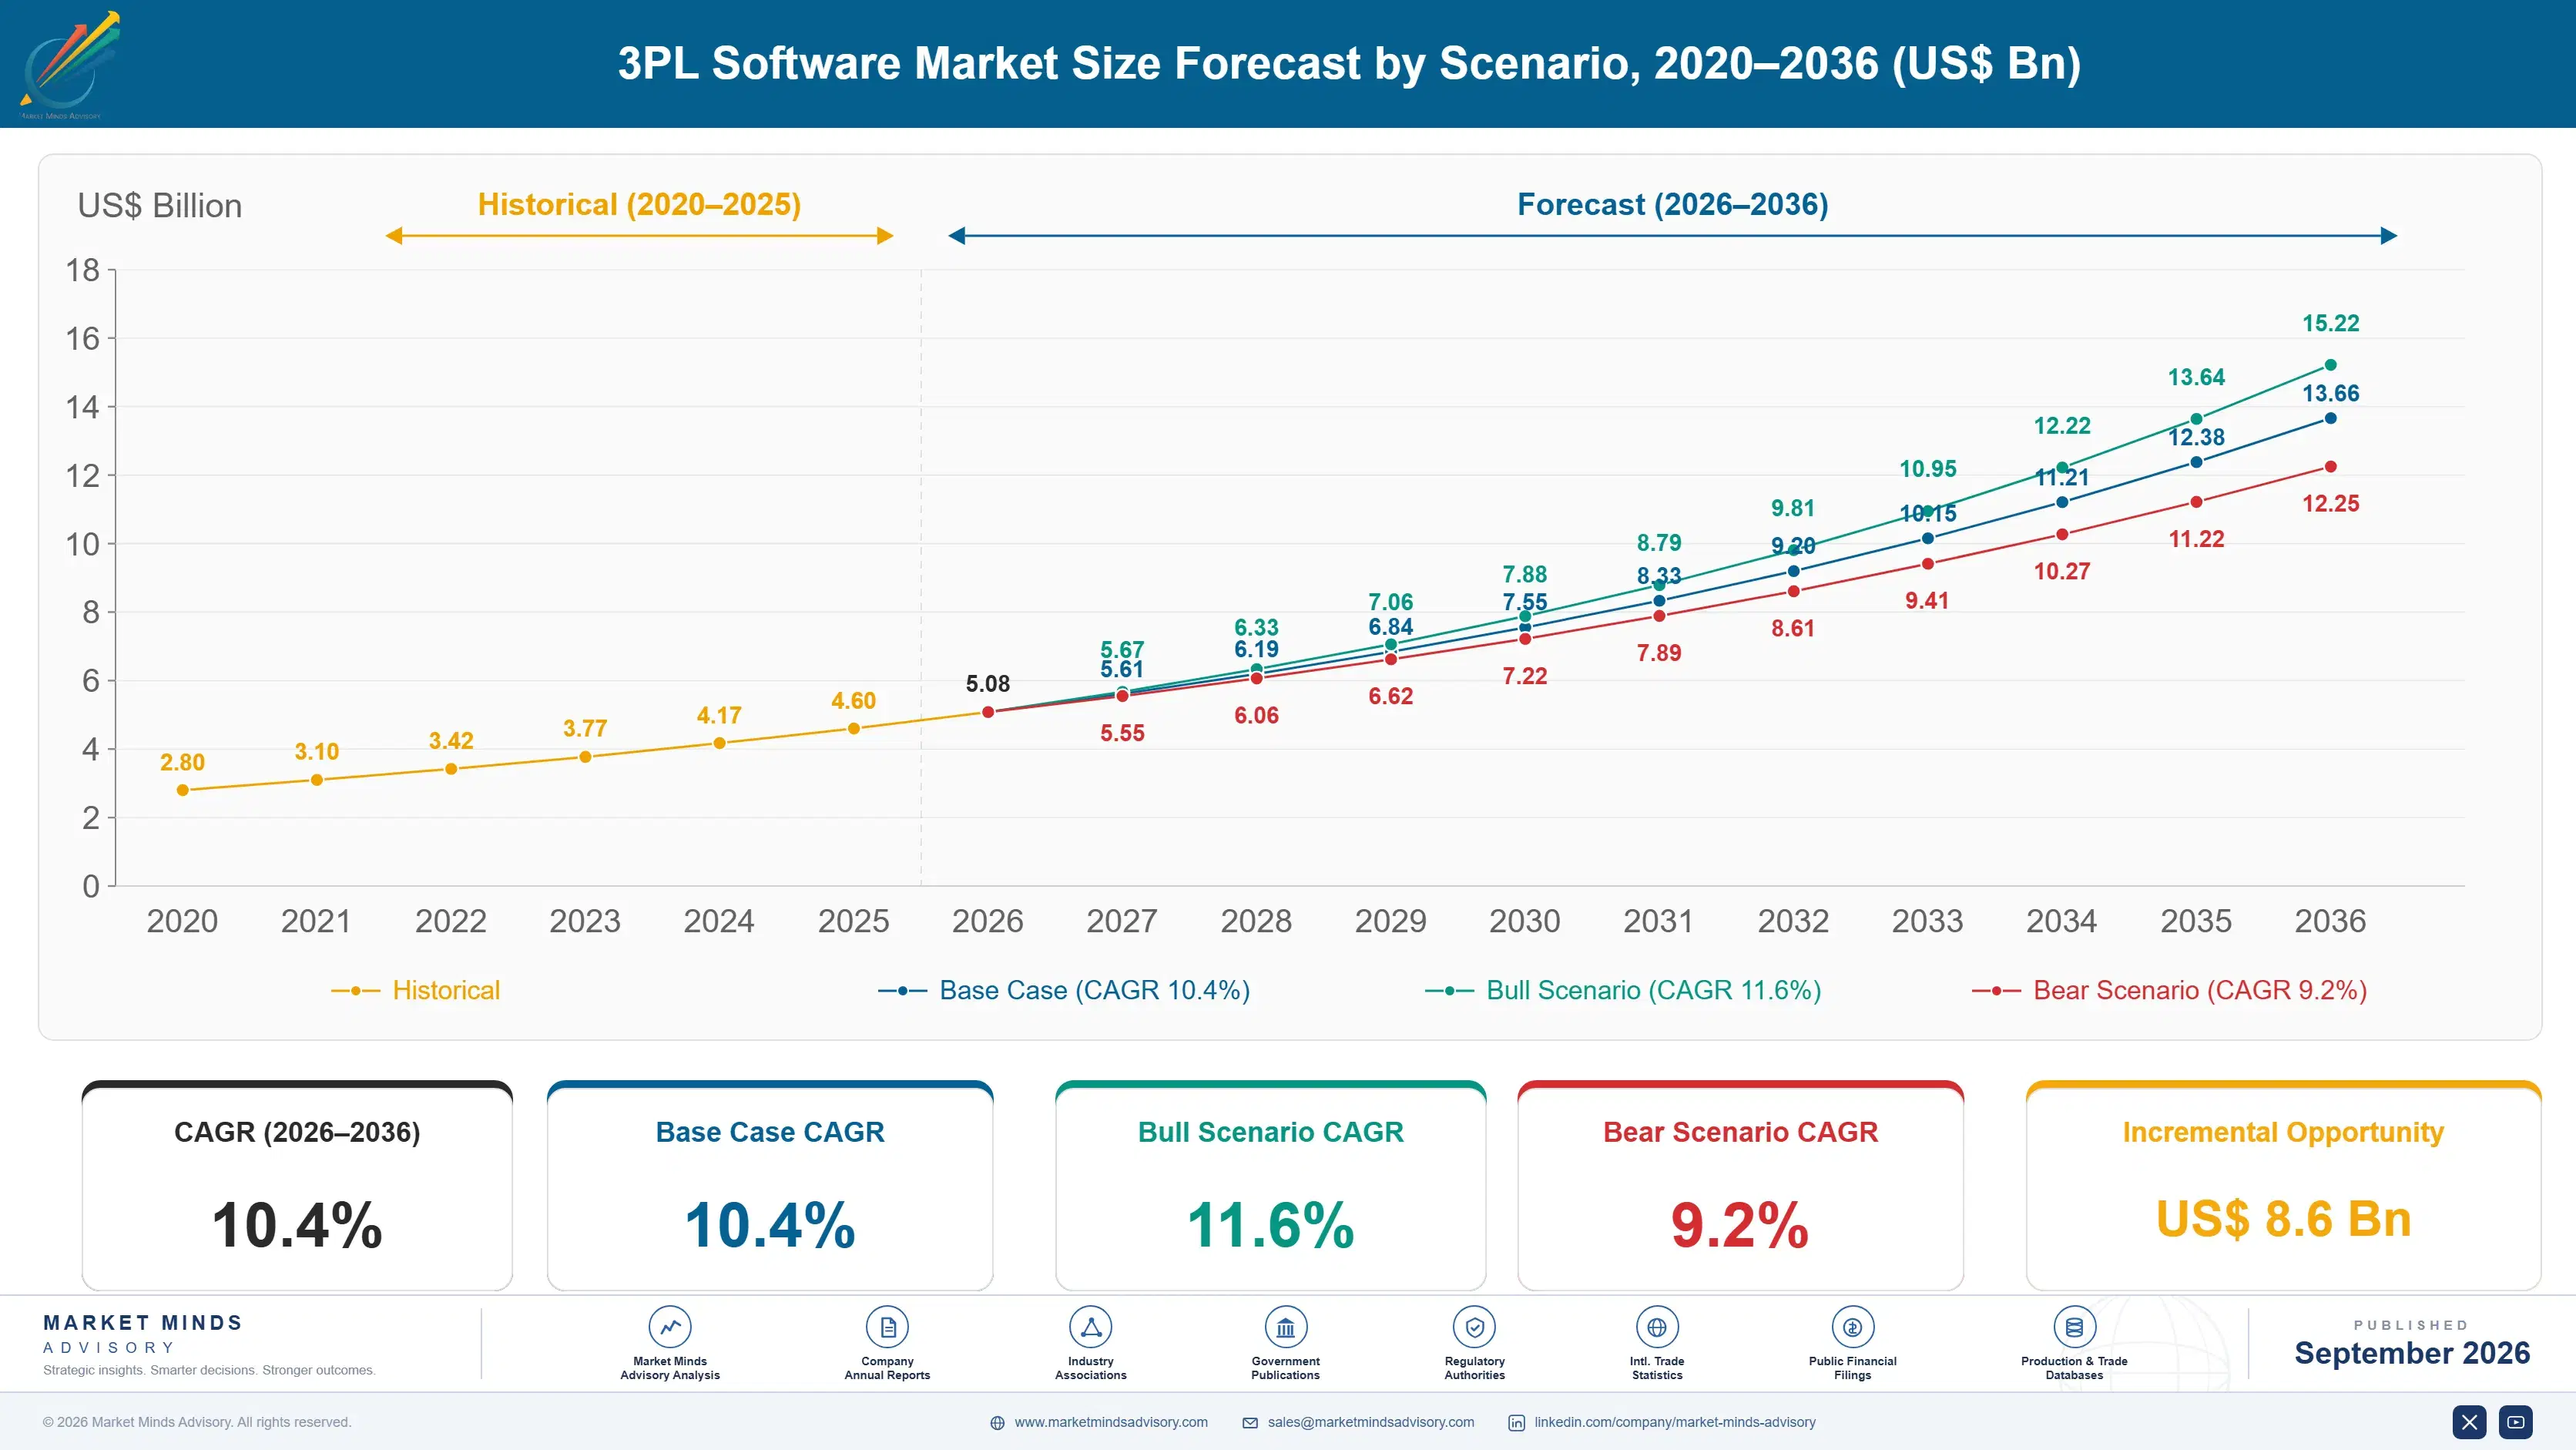
3PL Software Market Forecast Scenarios

3pl-software-market-size-forecast-scenario-1789993815276
Between 2020 and 2025 the category compounded at 9.3%, driven less by any technology change than by 3PL operators taking work that shippers had previously run themselves. E-commerce fulfilment volume moved outward to contract operators at speed, and each new client brought rate structures, service levels and reporting obligations that in-house-built systems handled badly or not at all. Software spending followed that transfer of operational responsibility.
The base case holds 10.4% on three mechanisms. Contract complexity keeps rising as clients demand service level reporting and penalty structures that must be measured automatically rather than reconstructed afterwards. Manufacturing relocation across Southeast Asia builds warehouse capacity where no legacy system exists, so new sites buy rather than extend. And custom-built systems written a decade ago are reaching the point where the people who wrote them have left the business entirely.
The bull case at 11.6% assumes the replacement wave from ageing custom systems arrives faster than operators currently plan, which would compress a decade of migration into far fewer years. The bear case at 9.2% is margin pressure: a 3PL earning three percent defers software spending easily, and rate competition in freight has removed the headroom that funds any discretionary project.

Software Judged On Billing Accuracy

The economics here are unforgiving in a way that shapes every purchase decision. A contract logistics operator nets roughly four percent, so a billing engine that misses seven percent of accessorial charges is not creating an efficiency problem. It is removing most of the profit on the account. Every software conversation in this industry starts there and most of them never move very far past it.
TOP FIVE CONCENTRATION37%Low for enterprise software, since many operators build their own
OPERATOR NET MARGIN4%Typical across contract logistics providers before any financing costs
UNBILLED ACCESSORIAL LEAKAGE7%Billable events never invoiced under manual capture processes
SYSTEM REPLACEMENT CYCLE11 yearsBetween major warehouse platform changes at a single site
IMPLEMENTATION DURATION14 monthsFrom contract signature to full operation across a network
CUSTOM BUILT SHARE41%Operators still running systems written by internal teams
The second thing that shapes the market is who the customer actually is. A 3PL runs many clients through one building, each with different rate cards, service levels, labelling requirements and reporting formats. General warehouse management software assumes one owner of the inventory. Retrofitting multi-client handling onto that assumption has defeated a considerable number of vendors who arrived from the shipper side confident it was a small change.
Roughly 41% of operators still run systems their own teams wrote, which is a remarkable figure for a software category this mature. Those systems handle the operator's specific contracts precisely because somebody built them to. The problem arriving now is that the people who wrote them have largely left, and nobody remaining is confident enough to modify a system that touches every invoice the business issues.
"Ask a 3PL operations director what the system needs to do and you get a list. Ask the finance director and you get one thing: bill everything we did. Those are the same requirement, and vendors who only hear the first version lose the account at renewal."
Director, Logistics Technology and Supply Chain Software Practice · MMA Technology Practice · September 2026

Market Trends

Contract Complexity Outgrows Manually Managed Billing

Client contracts now routinely carry tiered storage rates, activity-based handling charges, service level penalties and seasonal surcharge structures that nobody can reconstruct accurately from paperwork once the month has closed. Around 7% of billable events go uninvoiced under manual capture, which on a four percent net margin removes most of the profit earned on an account. Multi-client billing and contract management grows at 15.6% against 10.4% for the market as a whole, because operators have finally priced what that billing leakage was actually costing them across the course of a full year.
Market Impact: Vietnam compounds at 16.8% yearly

Ageing Custom Systems Approach Forced Replacement

Roughly 41% of 3PL operators run warehouse and billing systems written by their own teams, frequently a decade or more ago, and those systems encode the operator's specific contract structures with genuine and unusual precision. What has changed is that the original developers have largely left the business and nobody remaining will modify code touching every invoice the company issues. Replacement runs around 14 months and cannot interrupt shipping at any point, which is why operators keep deferring it until some specific client requirement finally forces the decision on them.
Market Impact: Penalties attach to 3 measures

Market Opportunities and Growth Drivers

Manufacturing Relocation Builds Warehousing Without Legacy

Production moving into Vietnam, Thailand, India and Mexico creates warehouse and distribution capacity where no incumbent system exists to extend, so those sites buy commercial software from the outset rather than adapting anything already running. Vietnam compounds at 16.8%, faster than any other country measured here, on manufacturing capacity that arrived within the past five years. A greenfield operator carries no migration risk and no internal development team defending code they wrote, which makes the purchase decision considerably faster than any equivalent replacement decision taken at any established operator elsewhere.
Market Impact: Operators net roughly 4% margin

Clients Demand Reporting Operators Cannot Produce Manually

Shippers contracting out fulfilment now require service level reporting, inventory accuracy measurement and order status visibility delivered continuously rather than compiled monthly by somebody working in an office. Client contracts increasingly attach financial penalties directly to those measures, which means the reporting has to be produced by the operating system itself rather than assembled afterwards from records. Visibility and customer portal platforms grow at 12.7% as a direct consequence, and contract logistics operators without them are now losing competitive tenders on capability rather than on the rate they happened to quote.
Market Impact: Implementation runs about 14 months

Market Restraints and Challenges

Thin Operator Margins Defer Discretionary Software Spending

A contract logistics operator nets roughly four percent, which leaves very little room indeed for capital projects that do not produce a return inside a single contract term. The root cause is freight and warehousing rate competition, where clients tender frequently and switch on price with almost no switching costs of their own. Commercially this pushes software decisions out repeatedly until something external finally forces them. Mitigation runs through subscription pricing converting capital expense into operating cost, and through business cases built on billing recovery rather than on claimed efficiency.
Market Impact: Leakage runs about 7% unbilled

Replacement Cannot Interrupt Continuous Warehouse Operation

A distribution centre ships every single day and cannot pause while a system changes underneath it, so replacement means around 14 months of parallel operation, phased site cutover and considerable operational risk throughout the whole period. The root cause is that warehouse software is not an administrative system at all: it directs physical work minute by minute. Commercially this extends replacement cycles out to around 11 years at a site. Mitigation runs through site-by-site rollout, hybrid operation across the transition period, and vendors agreeing to fund the parallel running themselves.
Market Impact: About 41% run custom systems
3 additional market trends, 4 additional growth drivers, and 2 additional restraints and challenges are covered in the full report. Contact sales@marketmindsadvisory.com to access the complete intelligence.

Segment CAGR and Growth Architecture

Segmentation follows application class, since each addresses a different operational function and carries different replacement economics and different competitive dynamics. Six classes cover the market, running from multi-client warehouse management through billing, transportation, yard scheduling, labour planning and customer visibility. Deployment model and operator size are separate commercial dimensions handled elsewhere in this report.
3pl-software-market-market-share-analysis-1789993815869

Multi-Client Billing And Contract Management

Multi-client billing grows at 15.6%, half again the market rate of 10.4%, because it addresses the one problem every operator can quantify precisely. Around 7% of billable events go uninvoiced under manual capture, and on a four percent net margin that removes most of the profit on an account. Contract structures carry tiered storage rates, activity-based handling charges, service level penalties and seasonal surcharges that nobody reconstructs accurately after the month closes. The business case effectively writes itself in a way that no operational efficiency argument has ever managed, which is exactly why this segment sells successfully into operators who defer more or less every other software purchase they are offered.
CAGR 15.6%

Visibility And Customer Portal Platforms

Visibility and customer portal platforms compound at 12.7% because shippers now write reporting obligations into contracts and attach financial penalties to them. Service level measurement, inventory accuracy and order status have to be produced continuously by the operating system rather than compiled monthly by staff working from records. Operators without that capability are losing tenders on capability rather than on price, which is a genuinely newer phenomenon in an industry that competed almost entirely on rate. The commercial subtlety is that the portal is used by the client rather than the operator, so it functions primarily as a client retention mechanism rather than as any kind of internal efficiency tool.
CAGR 12.7%
Full segment breakdown across 6 segments available in the complete report.

Regional Architecture and Country Demand Map

East Asia holds 26% of 3PL software spend, ahead of every other region, on contract logistics capacity that was built alongside the manufacturing it serves across China, Japan and South Korea. North America follows closely at 25% on e-commerce fulfilment outsourcing at very considerable scale.

East Asia

East Asia takes 26% of 3PL software spend, the largest regional share, because contract logistics capacity was built alongside the manufacturing it serves rather than arriving afterwards. Chinese operators run enormous multi-client networks with contract structures every bit as complex as anything in the West, and domestic vendors compete hard against international ones on local contract handling capability. Japanese and South Korean operators run high-precision fulfilment with service level obligations that make automated measurement effectively mandatory. Growth at 11.4% sits comfortably above the global rate across the region. Cross-border regional distribution across Southeast Asia adds documentation and contract complexity that purely domestic operators never once encounter in their own systems.
Share: 26% | CAGR: 11.4% (2026 to 2036)

North America

Twenty-five percent of spend reaches North America, where e-commerce fulfilment outsourcing at very large scale drives most demand. Retailers moved fulfilment to contract operators faster here than anywhere else, and each transfer brought rate structures and service level obligations that in-house-built systems handled poorly. Manhattan Associates, Blue Yonder and Oracle all hold substantial positions and compete directly for the same accounts. Custom-built systems remain widespread among mid-sized operators who wrote them years ago and now cannot safely modify them. Growth at 9.8% sits marginally below the global rate in a market where commercial software penetration is already comparatively high. Canadian and Mexican cross-border distribution adds further documentation complexity on top.
Share: 25% | CAGR: 9.8% (2026 to 2036)
Regional intelligence for 5 additional markets available in the complete report: Western Europe, South Asia and Pacific, Latin America, Middle East and Africa, Eastern Europe. Contact sales@marketmindsadvisory.com.
3pl-software-market-country-cagr-analysis-1789993816401

Where 3PL Software Deals Turn

Every purchase in this market is judged against a four percent net margin, the only business case that reliably survives finance review is billing recovery, and greenfield sites buy far more readily than established operators ever agree to replace. The four levers below follow that commercial reality rather than any argument about product capability.

Sell Billing Recovery Rather Than Operational Efficiency

Around 7% of billable events go uninvoiced under manual capture, and on net margins of roughly 4% that removes most of the profit on an account. A business case built on recovered revenue survives finance review in a way that no warehouse efficiency argument does, because the money is measurable and already earned. Vendors leading with picking productivity are presenting a projected saving that the customer discounts heavily. Vendors leading with billing leakage are describing money the operator has already worked for and simply failed to invoice to the client.
Market Impact: Recovering the full 7% leakage funds entire projects

Target Greenfield Sites Before Established Networks

A new distribution centre has no incumbent system to migrate, no parallel running period and no internal team defending code they wrote themselves. Vietnam compounds at 16.8% and Gulf transit hubs are being built new rather than expanded, which makes those decisions considerably faster than any replacement at an established operator running an 11 year cycle. The sales motion is entirely different: it follows facility construction and property investment rather than software renewal calendars, and the great majority of vendor coverage models are simply not built that way at all.
Market Impact: Greenfield sites avoid the 14 month migration entirely

Fund The Parallel Running Period Yourself

A distribution centre cannot stop shipping while its system changes, so replacement means around 14 months of parallel operation carrying real operational risk that the operator otherwise bears entirely alone. That risk, rather than the licence cost, is what actually defers the decision at an operator netting 4%. Vendors carrying the parallel running cost and staffing the transition themselves remove the actual objection rather than discounting against it. It is genuinely expensive and it converts deferred decisions into signed ones, which discounting on licence price has consistently failed to do.
Market Impact: Parallel running spans fully 14 months of operation

Build Multi-Client Handling Rather Than Retrofitting It

General warehouse software assumes a single owner of the inventory, and 3PL operations violate that assumption in every direction: many clients, many rate cards, many labelling standards and many reporting formats through one building. Vendors arriving from the shipper side have repeatedly underestimated this and lost accounts at the first complex contract. Around 41% of operators still run their own code specifically because commercial products handled their contracts badly. Multi-client architecture built in from the very start is the entry requirement in this market rather than any kind of differentiator.
Market Impact: Roughly 41% still run their own custom code

Who Controls the Margin Pool

Five vendors hold 37% of 3PL software licence and subscription revenue, which is unusually low for enterprise software and reflects that roughly 41% of operators still run systems their own teams wrote. Manhattan Associates, Blue Yonder, Korber Supply Chain, SAP and Oracle lead the commercial market. All participants here are assessed on licence and subscription revenue drawn specifically from third-party logistics customers rather than on any broader software revenue.
Competition runs on multi-client contract handling far more than on warehouse functionality, which most products handle adequately. Vendors are competing on whether the billing engine captures every accessorial charge in a complex contract and whether the reporting satisfies penalty clauses automatically. The second dimension is implementation risk, since operators fear the 14 month transition period considerably more than they resent the licence price they are being asked to pay.

Pressure is emerging from specialist billing vendors selling alongside incumbent warehouse systems rather than attempting to replace them, which sidesteps the migration objection entirely and reaches operators who would never commit to a full transition. Rankings shift in greenfield markets where no incumbent system exists at all, particularly across Southeast Asia and the Gulf, rather than in established networks.
3pl-software-market-company-positioning-matrix-1789993816954

Competitive Moat and Risk Dimensions

MANHATTAN ASSOCIATES

Moat: Multi-Client Contract Depth

Manhattan built multi-client handling into the product rather than retrofitting it, which matters because 3PL contracts violate every assumption a single-owner warehouse system makes about inventory, rates and reporting. That capability accumulated across many operator implementations, each contributing contract structures the product then handled natively. Competitors arriving from the shipper side discovered the gap only after losing accounts.
MANHATTAN ASSOCIATES

Risk: Replacement Cycle Dependency

Revenue depends substantially on operators replacing systems on cycles running around 11 years, and a distribution centre that cannot stop shipping defers that decision easily at four percent net margin. Specialist billing vendors selling alongside incumbent systems remove the migration objection entirely without requiring replacement. That route reaches operators who will not commit to a 14 month transition at all.
BLUE YONDER

Moat: Transportation And Warehouse Integration

Blue Yonder covers warehouse and transportation management together, which matters because a 3PL frequently sells both and needs one view of a client's cost to serve. Operators running separate systems reconcile between them manually, reintroducing exactly the billing leakage the software was bought to prevent. That combined coverage is difficult to assemble from separate products.
BLUE YONDER

Risk: Breadth Against Specialist Depth

Broad coverage competes against specialist billing and visibility products that solve one problem more completely, and 3PL buyers evaluate on the specific problem costing them money right now. A billing engine capturing 7% more accessorial revenue wins against integrated breadth in that conversation. Defending the position requires the billing capability to be genuinely competitive rather than merely present.

Players Tracked

Prominent Players

Manhattan Associates
Blue Yonder
Korber Supply Chain
SAP
Oracle

Other Key Players

Infor
Softeon
Made4net
Deposco
3PL Central
Extensiv
Tecsys
Generix Group
Reply
Zebra Technologies
Descartes Systems Group
e2open
Logiwa
HighJump
Mecalux Easy WMS

Recent Developments

APRIL 2025

Manhattan Associates Extends Multi-Client Billing Capability

Manhattan Associates extended billing and contract management capability for third-party logistics customers, an organic product development rather than an acquisition or partnership. Around 7% of billable events go uninvoiced under manual capture processes, which on net margins near four percent removes most of the profit earned on an account.
Signal: Billing accuracy has now become the primary purchase criterion here, rather than the warehouse functionality itself.
JANUARY 2025

Vietnamese Logistics Operators Commission New Distribution Capacity

Multiple Vietnamese contract logistics operators commissioned distribution capacity serving manufacturing that relocated into the country, capacity development rather than any corporate transaction. Greenfield sites carry no incumbent system to migrate and no internal development team defending existing code, which makes software purchase decisions considerably faster.
Signal: A newly built warehouse buys commercial software simply because there is nothing already there to extend.
AUGUST 2024

Korber Supply Chain Broadens European Multi-Client Deployment

Korber Supply Chain broadened deployment across European contract logistics operators handling cross-border distribution, an organic commercial expansion rather than any merger or acquisition. Cross-border movement carries customs, tax and documentation obligations that purely domestic operations never encounter, which shapes system requirements quite independently of warehouse volume.
Signal: Cross-border regulatory complexity sells this software in places where domestic warehouse volume alone never really would.

What Delivering This Software Costs

Implementation and professional services absorb roughly 44% of vendor cost of delivery, which is high even by enterprise software standards and reflects that every 3PL contract structure differs. Engineering and product development take around 27%, concentrated in billing logic and multi-client handling. Cloud infrastructure absorbs about 14%, and ongoing customer support takes most of the balance across long deployment lifetimes.
Cloud infrastructure pricing rose materially through 2023 and 2024 as demand outpaced capacity across major providers, and vendors on fixed subscription contracts absorbed most of that movement rather than repricing customers. SAP Annual Report 2024 and Oracle Annual Report 2024 both record infrastructure cost and capacity investment as significant operating factors. Vendors with committed capacity agreements managed the period considerably better than those buying on demand.

The competitive disadvantage mechanism is implementation cost rather than infrastructure. A vendor whose product needs heavy configuration for each 3PL contract structure carries 44% delivery cost against one whose product handles those structures natively. Exposure concentrates among vendors retrofitting multi-client capability onto single-owner architecture, where every genuinely complex contract turns into a services project rather than a configuration exercise the customer can complete alone.
3pl-software-market-cost-volatility-analysis-1789993817151

Configure Contract Structures Rather Than Building Them

Implementation absorbs roughly 44% of delivery cost, most of it spent building contract-specific billing logic for each customer individually. Product capability that handles tiered rates, accessorial charges and penalty structures through configuration converts that services work into setup. The investment sits in product engineering rather than in services headcount, which is a considerably better place for it commercially.

Commit Cloud Capacity Against Subscription Terms

Cloud infrastructure runs around 14% of delivery cost and pricing moved materially as provider demand outpaced capacity. Subscription contracts fix revenue for years while infrastructure cost floats, which puts the vendor on the wrong side of any movement. Committed capacity agreements matched to subscription term length remove exposure that fixed-price contracts otherwise leave entirely open.

Reuse Implementation Patterns Across Operator Types

Contract logistics operators differ considerably, though not infinitely: retail fulfilment, automotive supply and cold chain each repeat structures across many customers. Building reusable implementation patterns per operator type rather than treating each deployment as unique reduces the 44% delivery cost meaningfully. Most vendors discover the repetition eventually and comparatively few organise deliberately around it.

Portfolio Architecture for Margin Defence

Margin architecture separates on how much configuration each deployment requires. Yard and dock scheduling earns least, since the function is comparatively standard and several capable products compete on price. Labour management and transportation sit above it. Multi-client billing, contract management and visibility platforms earn most, because they address problems the operator can quantify in recovered revenue rather than in claimed efficiency.
The volume versus premium tension runs between licence and services rather than between products. Implementation absorbs roughly 44% of delivery cost, and vendors carrying that as services headcount earn far less per customer than vendors whose products configure. The temptation is to treat services as a revenue line, which works commercially until a competitor arrives whose product simply does not need the work.

High-value pools concentrate in billing and contract management, where the business case is measurable and the buyer is the finance director rather than operations. That segment sells into operators who defer every other purchase, because recovered revenue is not a projected saving. Reaching it requires commercial coverage aimed at finance rather than at warehouse management, which most vendors are not organised to do.

Volume / Commodity-Adjacent

Yard and dock scheduling and basic labour management, where the function is comparatively standard and several capable products compete largely on price. The ten point spread separates cloud subscription delivery from deployments still requiring on-premise installation and support.
Gross Margin: 48% to 58%

Premium / Certified

Multi-client warehouse management and transportation management, where multi-client architecture and integration breadth determine selection alongside functionality. The ten point spread tracks how much configuration each deployment requires, which varies enormously between products built for this and products adapted to it.
Gross Margin: 62% to 72%

Sustainability / Regulatory / Next-Generation

Multi-client billing, contract management and customer visibility platforms, sold against measurable recovered revenue rather than projected efficiency. The twelve point spread reflects how much contract logic sits in configuration rather than in per-customer development work.
Gross Margin: 74% to 86%
3pl-software-market-portfolio-architecture-1789993817657

High-value Sub-segments and Strategic Watch-out

Multi-Client Billing And Contract Management

Grows at 15.6% because around 7% of billable events go uninvoiced under manual capture, which removes most profit at four percent net margin. The twelve point spread reflects configuration depth. Finance directors buy this readily in businesses where operations directors defer more or less everything else offered.
Gross Margin: 74% to 86%

Visibility And Customer Portal Platforms

Grows at 12.7% as shippers write reporting obligations carrying financial penalties directly into the contract logistics agreements they sign. The twelve point spread reflects platform integration depth. The client rather than the operator actually uses it, which makes it a client retention mechanism first and foremost.
Gross Margin: 74% to 86%

Multi-Client Warehouse Management

Grows at 9.8% as operators replace ageing custom-built systems on cycles running around 11 years between one major platform change and the next. The ten point spread reflects per-deployment configuration requirements. Replacement carries around 14 months of parallel running that operators consistently defer for as long as possible.
Gross Margin: 62% to 72%

Yard And Dock Scheduling

Grows at 7.2%, slowest of the six application classes, on a function comparatively standard across operators with several genuinely capable products competing for it. The ten point spread reflects the delivery model alone. Very little contract-specific logic exists here for any vendor to defend a position with.
Gross Margin: 48% to 58%

Why These Systems Persist

The annuity here comes from operational dependency rather than from any contract term. A warehouse management system directs physical work minute by minute and a distribution centre cannot stop shipping while it changes, so replacement means around 14 months of parallel running carrying real risk. Cycles consequently run near 11 years. An incumbent vendor is defended by operational reality more effectively than by any contract.
Depth varies considerably by function. Billing and contract management embeds most deeply, since every invoice the operator issues depends on it and the contract logic accumulated over years exists nowhere else. Warehouse management is similarly entrenched through operational dependency. Yard scheduling and labour planning are far more substitutable, because replacing either disrupts one process rather than the whole building. Vendors frequently price all of them as though they were equally defended.

The buyer has moved from operations toward finance, and that has changed what wins. An operations director evaluated systems on functionality and implementation risk. A finance director evaluates on recovered billing revenue against a four percent net margin, which is a completely different conversation. Vendors whose commercial organisation still calls exclusively on warehouse operations are pitching to somebody who no longer signs.
3pl-software-market-end-use-penetration-index-1789993818147

What Wins 3PL Accounts

These are among the four positions where our research anticipates prominent divergence between winners and laggards over the coming forecast period. Each is grounded in the demand model, the regulatory perimeter, and the announced capacity pipeline.
01 / BILLING RECOVERY POSITIONING

Sell Recovered Revenue, Not Claimed Efficiency

Around 7% of billable events go uninvoiced under manual capture processes, and on the roughly four percent net margins contract logistics operators run, that leakage removes most of the profit earned on an account. A business case built on recovered revenue survives finance review in a way that no warehouse efficiency argument has ever reliably managed. Vendors leading with picking productivity are presenting a projected saving that the customer discounts heavily long before anybody in the business signs anything at all.
02 / GREENFIELD SITE COVERAGE

Follow Construction Rather Than Renewal Calendars

A newly built distribution centre carries no incumbent system to migrate, no parallel running period and no internal development team defending code they wrote themselves years ago. Vietnam compounds at 16.8% and Gulf transit hubs are being built new rather than expanded, which makes those purchase decisions far faster than any replacement at an operator on an 11 year cycle. Reaching those sites requires commercial coverage that follows facility construction and property investment rather than following any kind of software renewal calendar.
03 / TRANSITION RISK ABSORPTION

Carry The Parallel Running Cost Yourself

A distribution centre cannot stop shipping while its system changes underneath it, so replacement means around 14 months of parallel operation carrying operational risk the operator otherwise bears entirely alone. That risk rather than licence price is what defers the decision at an operator netting roughly four percent. Vendors funding the parallel running period and staffing the transition themselves remove the actual objection instead of discounting hard against a licence price that nobody in the room was really disputing anyway.
04 / MULTI-CLIENT ARCHITECTURE DEPTH

Build It In Rather Than Retrofitting Later

General warehouse software assumes a single owner of the inventory, and third-party logistics operations violate that assumption completely across clients, rate cards, labelling standards and reporting formats within one building. Around 41% of operators still run code their own teams wrote, specifically because the available commercial products handled their contract structures badly or not at all. Vendors arriving from the shipper side have repeatedly discovered this gap only after losing an account outright at the first genuinely complex client contract they encountered.

Engagement Snapshot From the Field

A live engagement with an industry participant carrying material or product regulatory and market exposure ahead of a defining policy shift, showing how our research translates into a defensible multi-year portfolio strategy.
MARKET MINDS ADVISORY · CLIENT ENGAGEMENT SUMMARY
3PL Software Producer Strategic Portfolio Review and Transition Roadmap 2026·Investment Scenario on 3PL Software Exposure Evaluation 2025-26
CLIENT PROFILE
A contract logistics operator running eleven distribution centres across two countries on a warehouse and billing system its own team had written more than a decade earlier. Net margin sat near the industry average and the finance function suspected billing leakage without being able to quantify it. The two developers who understood the billing logic had both left within the previous eighteen months.
STRATEGIC CHALLENGE
Operations wanted a replacement warehouse system and had shortlisted three vendors on functionality. Finance was unconvinced the project would pay back inside any contract term. Nobody had measured what the existing system was failing to bill, so the entire business case rested on efficiency claims that finance had already discounted twice in previous years.
MMA APPROACH
MMA reconstructed billable events across a sample of client contracts and compared them against invoices actually issued, which established the leakage rate directly rather than by estimate. We assessed the shortlisted products specifically on contract structure handling rather than on warehouse functionality, and modelled a phased rollout. The work drew on 47 expert interviews conducted in Q4 2025 with operators and vendors.
KEY FINDINGS
  1. Uninvoiced billable events ran close to 8% across the sampled client contracts, concentrated almost entirely in accessorial charges and seasonal surcharge structures.
  2. Two of the three shortlisted products required substantial per-contract development work to handle the operator's tiered storage rates rather than simply configuring them.
  3. Recovered billing revenue alone justified the project inside two contract terms, without counting any operational efficiency at all (client-reported, unverified by MMA).
  4. The existing system's billing logic was entirely undocumented, and nobody remaining in the business could safely modify it to support any new client contracts.
CLIENT PROFILE
A contract logistics operator running eleven distribution centres across two countries on a warehouse and billing system its own team had written more than a decade earlier. Net margin sat near the industry average and the finance function suspected billing leakage without being able to quantify it. The two developers who understood the billing logic had both left within the previous eighteen months.
STRATEGIC CHALLENGE
Operations wanted a replacement warehouse system and had shortlisted three vendors on functionality. Finance was unconvinced the project would pay back inside any contract term. Nobody had measured what the existing system was failing to bill, so the entire business case rested on efficiency claims that finance had already discounted twice in previous years.
MMA APPROACH
MMA reconstructed billable events across a sample of client contracts and compared them against invoices actually issued, which established the leakage rate directly rather than by estimate. We assessed the shortlisted products specifically on contract structure handling rather than on warehouse functionality, and modelled a phased rollout. The work drew on 47 expert interviews conducted in Q4 2025 with operators and vendors.
KEY FINDINGS
  1. Uninvoiced billable events ran close to 8% across the sampled client contracts, concentrated almost entirely in accessorial charges and seasonal surcharge structures.
  2. Two of the three shortlisted products required substantial per-contract development work to handle the operator's tiered storage rates rather than simply configuring them.
  3. Recovered billing revenue alone justified the project inside two contract terms, without counting any operational efficiency at all (client-reported, unverified by MMA).
  4. The existing system's billing logic was entirely undocumented, and nobody remaining in the business could safely modify it to support any new client contracts.
RECOMMENDED STRATEGY
Phase 1: Phase one: rebuild the business case entirely on measured billing leakage rather than on the operational efficiency claims finance had already rejected. Phase 2: Phase two: reweight vendor selection toward contract structure configuration capability, which immediately eliminated two of the three products already shortlisted. Phase 3: Phase three: roll out site by site with parallel running, starting at the distribution centre with the simplest contract structures.
OUTCOME
The operator selected on billing capability rather than warehouse functionality and the project was approved on recovered revenue (client-reported, unverified by MMA). Rollout began at two sites with parallel running funded partly by the vendor. Finance now measures billing capture continuously, which was the change that outlasted the selection decision itself.

Frequently Asked Questions

Foundational context covering the market sizes, CAGR, scope, country, region and competition that inform every finding below. This section is provided to cover basics and most often pre-purchase conversations, answered from the MMA Primary Research Dataset.

What is the current size of the 3PL Software Market?

Global value reaches USD 5.1 billion in 2026, measured as licence and subscription revenue from third-party logistics providers. The 2025 base is USD 4.6 billion.

How large will the 3PL Software Market be by 2036?

The market reaches USD 13.7 billion by 2036, an increase of USD 8.6 billion across the forecast period. That represents 2.69 times expansion from the 2026 base.

What is the CAGR for the 3PL Software Market 2026 to 2036?

The base case runs at 10.4% annually, with a bull case at 11.6% if custom system replacement accelerates and a bear case at 9.2% if operator margin pressure keeps deferring discretionary software spending.

Which segment is growing fastest?

Multi-client billing and contract management grows at 15.6%, half again the market rate of 10.4%. Around 7% of billable events go uninvoiced under manual capture processes.

Who are the major companies in the 3PL Software Market?

Manhattan Associates, Blue Yonder, Korber Supply Chain, SAP and Oracle lead on licence and subscription revenue, together holding 37%. Infor, Softeon and Deposco hold smaller positions.

Which country is growing fastest?

Vietnam leads at 16.8%, on warehouse capacity built for manufacturing that relocated into the country within the past five years. India and Mexico both follow closely behind.

Report Segmentation Architecture

The full report scope spans multiple orthogonal segmentation dimensions, with cross-tabulated demand data provided for each dimension pair. Coverage extends further to regional breakdowns, trend trajectories, and the competitive detail needed to support segment-level decision-making.

By Application Class

  • Multi-Client Billing And Contract Management
  • Visibility And Customer Portal Platforms
  • Multi-Client Warehouse Management
  • Transportation Management
  • Labour Management And Workforce Planning
  • Yard And Dock Scheduling

By End-Use Industry

  • Retail And E-Commerce Fulfilment
  • Automotive And Industrial Distribution
  • Cold Chain And Food Logistics
  • Healthcare And Pharmaceutical Distribution
  • Consumer Goods Warehousing
  • Cross-Border And Freight Forwarding

By Commercial Dimension

  • Cloud Subscription Delivery
  • On-Premise Licensed Deployment
  • Large Multinational Operators
  • Mid-Sized Regional Operators
  • Direct Vendor Sales
  • Systems Integrator Channel

By Region

  • North America
  • Western Europe
  • East Asia
  • South Asia and Pacific
  • Latin America
  • Middle East and Africa
  • Eastern Europe

Scope, Methodology, and Coverage

Every figure in this report is reproducible from documented input assumptions. The scope below maps the historical period, the forecast horizon, the segmentation dimensions, and the countries covered, alongside the underlying primary and qualitative methodology.
Historical Period
2020 to 2025
Forecast Period
2026 to 2036
Base Year
2025 (USD billions; MMA Primary Research Dataset, September 2026)
Market Definition
This report covers software licensed or subscribed by third-party logistics providers by application class: multi-client warehouse management, transportation management, multi-client billing and contract management, yard and dock scheduling, labour management and workforce planning, and visibility and customer portal platforms. It excludes software used by shippers managing their own logistics in-house, freight brokerage marketplaces, parcel carrier systems, physical automation control software, and enterprise resource planning suites.
Quantitative Units
USD millions, licence and subscription revenue basis; deployed sites; implementation duration in months; billing leakage as a percentage of billable events; operator net margin percentage.
Segmentation Dimensions
Application class; end-use industry served; deployment model and operator size; geography across seven regions.
Regions Covered
North America, Western Europe, East Asia, South Asia and Pacific, Latin America, Middle East and Africa, Eastern Europe
Countries Covered
United States, Canada, Mexico, Brazil, Chile, Colombia, Germany, Netherlands, Belgium, France, United Kingdom, Poland, Czechia, China, Japan, South Korea, India, Vietnam, Thailand, United Arab Emirates.
Key Companies Profiled
Manhattan Associates, Blue Yonder, Korber Supply Chain, SAP, Oracle, Infor, Softeon, Made4net, Deposco, Extensiv, Tecsys, Generix Group, Descartes Systems Group, e2open, Logiwa.
Quantitative Methodology
Primary survey, n=3,800 respondents, Q4 2025, six countries; demand-side model with trade association cross-validation
Qualitative Methodology
47 expert interviews, Q4 2025; applied to validate demand model assumptions, identify emerging dynamics, and assess competitive positioning
Report Format
PDF and XLSX data workbook (Word format preview document)
Publisher
Market Minds Advisory
Report Code
MMA-2026-TEC-661
Published
September 2026
Contact
sales@marketmindsadvisory.com | www.marketmindsadvisory.com

Purchase the full 3PL Software Market Report (2026 to 2036).

This report sizes the global 3PL software market from 2026 to 2036 across six application classes, six end-use industries and seven regions. It explains why billing accuracy rather than warehouse functionality now decides purchases, quantifying uninvoiced billable events at roughly 7% against operator net margins near four percent. Custom-built systems at 41% of operators are analysed as the replacement wave building behind the market. Delivery cost composition is sourced to company annual reports, with implementation at 44% examined as the competitive variable. Regional analysis explains why East Asia leads at 26% of spend.
Six application classes sized through to 2036
Billing leakage quantified against operator net margins
Custom-built system replacement wave assessed by region
Twenty named vendors assessed on subscription revenue
Four revenue levers with quantified commercial impact
Anonymised contract logistics selection engagement documented in full

Built For The People Who Decide

From boardroom strategy to bench-side execution, this report is read cover-to-cover by leaders shaping the next decade of their industry, turning demand scenarios, market dynamics and valuation benchmarks into decisions.
CXOs/ Presidents/ VPs/ Managers
M&A and Corporate Development
Strategy Teams and R&D Heads
Procurement and Product Directors
Regulatory and Compliance Leaders
Investor Relations and Equity Analysts