Market Minds Advisory
3D Printing Market

3D Printing Market: 3D Printing Market: Prototyping Reality, Qualification Barriers and the Dental Business Nobody Set Out to Build

Most machine time still validates designs rather than making parts, and the largest production application by volume is dental work that almost nobody in this industry originally set out to serve.

Lead Analyst

Published

September 2026

Make Smarter Decisions with Customized Research Insights

Request a free sample report and evaluate market opportunities, growth trends, and competitive dynamics relevant to your business needs.

2025 MARKET VALUE$21.5BMarket Size 2025
2036 FORECAST VALUE$53.3BBase Case , 2026 to 2036
CAGR 2026 TO 20368.6 %Bull 9.8% / Bear 7.4%
INCREMENTAL OPPORTUNITY$29.9BNet 10- year value creation
EXPANSION MULTIPLE2.28x2036 value over 2026 base
Strategic Levers
M&A Pipeline
Regional Outlook
Country Rankings
Competitive Intelligence
Segmental Deep-dive
Call-Us : 91 93563 13602

Executive Snapshot and Market Trajectory.

Roughly 54% of industrial machine time is spent validating designs rather than making anything a customer receives. That is a genuine and durable business, and it is a design tool rather than the manufacturing revolution this industry spent fifteen years describing. Investors were told otherwise for a very long time.
Where production does happen, it looks nothing like the original ambition. Dental and orthodontic work accounts for 44% of production part volume and grows at 12.9%, half again the market rate of 8.6%, because aligner moulds need geometric variation that no conventional process handles economically. North America takes 34% of value on production applications, though East Asia builds far more machines and ships considerably more units.
Concentration is very low at roughly 26% across the top five on measured hardware, materials and services revenue, and the profit distribution is uneven. Materials are 38% of revenue and recur; machines sell once and have made very little money for anybody. Qualification takes 26 months in regulated production, which locks positions once earned. Service bureaus sit between hardware and materials and earn steadily on the depreciation everybody else avoided taking.
Market Definition
This market covers additive manufacturing hardware, materials and services, spanning prototyping and design validation, dental and orthodontic production, medical implants and surgical guides, aerospace and defence part production, tooling, moulds and jigs, and industrial spare parts and low volume production. Revenue is measured as machine shipment, materials supply and service bureau value at supplier level. Conventional subtractive machining, injection moulding, casting, design software sold standalone, and construction-scale concrete printing are excluded.
Base Year Value
$21.5B in 2025 (MMA Primary Research Dataset, September 2026)
Forecast Period
2026 to 2036, eleven discrete annual values
CAGR
8.6% base case. Bull 9.8%. Bear 7.4%.
Fastest Growth Segment
Dental and Orthodontic Production: 12.9% CAGR
Fastest Growth Country
India: 13.2% CAGR
Fastest Growth Region
South Asia and Pacific: 10.6% CAGR
Largest Region
North America: 34% of 2025 global value
Market Leaders
Stratasys, 3D Systems, HP, EOS and Nikon SLM Solutions lead on measured additive manufacturing hardware, materials and services revenue. Source: MMA Primary Research Dataset, July 2026.
Primary Survey
n=3,800 procurement and R&D decision-makers, Q4 2025, six countries
Methodology
Demand-side build-up, cross-validated against public data, 47 expert interviews

3D Printing Market Forecast Scenarios

3d-printing-market-size-forecast-scenario-1788423648992
Growth ran at 7.6% from 2020 to 2025, well below what the previous decade's expectations implied, and the composition changed considerably. Desktop and consumer hardware commoditised as low-cost machines from new manufacturers took the entry market and removed its margin. Industrial machine sales flattened through 2023 and 2024 as customers ran existing capacity harder, while materials and bureau revenue kept growing against the installed base.
The base case at 8.6% rests on three mechanisms rather than on broad manufacturing adoption. Dental and orthodontic production requires per-patient geometry that conventional methods cannot supply economically, and it accounts for 44% of production part volume already. Medical implants and surgical guides follow the same logic with higher regulatory content. Third, tooling and mould inserts benefit from conformal cooling geometries that improve conventional moulding rather than replacing it. Broad adoption is not assumed.
The bull case at 9.8% assumes qualification pathways for regulated printed parts shorten materially, which would release aerospace and medical applications currently held back by 26 month certification timelines. The bear case at 7.4% is that machine utilisation stays near 31% and customers keep running existing capacity rather than buying more, which is what the past three years have already demonstrated.

A Design Tool That Found Two Production Jobs

The honest description of this industry is that it built an excellent design tool and found two production applications. Around 54% of industrial machine time goes to prototyping, which shortens development cycles measurably and produces nothing a customer receives. That is worth having and it is not manufacturing. Treating it as evidence of a production transition has misled investors for a decade.
TOP FIVE CONCENTRATION26%Fragmented across machine builders, materials firms and bureaus
PROTOTYPING SHARE OF USE54%Machine time spent validating designs rather than making parts
MATERIALS REVENUE SHARE38%Industry revenue from consumables rather than machine sales
PART QUALIFICATION DURATION26 monthsTime to certify a printed part for regulated production use
MACHINE UTILISATION RATE31%Available hours industrial printers actually spend building parts
DENTAL VOLUME SHARE44%Production part volume attributable to dental and orthodontic work
Where production does happen, geometry rather than cost is the reason. Clear aligner moulds need a different shape for every patient and stage, which conventional tooling cannot supply at any sensible price, and dental now represents 44% of production volume. Orthopaedic implants follow the same logic with porous structures that improve bone integration. Aerospace uses it where consolidating an assembly into one printed part removes joints, weight and failure modes.
The commercial distribution is uneven in a way the industry discusses reluctantly. Materials are 38% of revenue, recur with every build and carry good margins. Machines sell once, depreciate at 31% utilisation on the customer's books, and have generated very little profit. Service bureaus sit between the two and earn steadily. Qualification at 26 months for regulated parts is what locks a position once somebody has earned it.
"This industry keeps describing itself as manufacturing and keeps earning its living from prototyping, dental moulds and powder. Those are real businesses. They are just not the businesses anybody raised money against, which is why the earnings and the narrative have diverged so completely."
Director, Advanced Manufacturing Technologies Practice · MMA Construction and Industrial Equipment Practice · September 2026

Market Trends

Consumables Carry the Profit While Machines Do Not

Materials represent 38% of industry revenue, recur with every build and carry margins that machine sales have never approached, since printers are bought once and then depreciate on the customer's books at around 31% utilisation. Manufacturers have responded by qualifying materials to their own machines and restricting parameter sets, which protects consumable revenue and irritates customers who wanted an open platform. Open material strategies win machine sales and forfeit the recurring revenue that makes the installed base worth having. Almost every manufacturer has now chosen the closed approach. That choice defines the industry now.
Market Impact: Dental holds 44% of volume
Low-Cost Machines Removed the Entry Market Entirely

Desktop and light industrial machines from newer manufacturers reached quality levels that satisfy prototyping requirements at a fraction of established pricing, which removed the entry segment that once funded customer relationships. Established vendors did not lose those customers to a better product so much as to a sufficient one costing considerably less. The consequence is that the industry's traditional route to a customer, starting small and growing into industrial equipment, has closed. Vendors now have to win at the industrial end directly, where sales cycles are long and qualification barriers are severe.
Market Impact: Consolidates 12 parts into one

Market Opportunities and Growth Drivers

Per-Patient Geometry Makes Dental Production Unavoidable

Clear aligner treatment requires a distinct mould for every patient at every treatment stage, which means millions of unique geometries that conventional tooling cannot produce at any economic price. That is the single application where additive manufacturing is not competing against an alternative, and it now accounts for 44% of production part volume. Growth at 12.9% follows aligner treatment volumes rather than any manufacturing trend. It also concentrates demand among a small number of very large customers, which shapes pricing considerably more than the technology does. Volume concentration shapes pricing more than technology does.
Market Impact: Certification runs 26 months

Part Consolidation Removes Assemblies Rather Than Cost

Aerospace and industrial applications adopt additive manufacturing where printing one component replaces an assembly of several, removing joints, fasteners, weight and the failure modes associated with each. The saving is rarely in production cost, which usually rises, and almost always in weight, reliability or inventory. Certification bodies accept the argument where the part is demonstrably simpler than what it replaced. That framing wins programmes that a cost comparison would lose immediately, and suppliers who lead with cost per part consistently misread what the engineer is evaluating. Cost per part is the wrong comparison entirely.
Market Impact: Utilisation stalls near 31%

Market Restraints and Challenges

Qualification Takes Over Two Years in Regulated Production

Certifying a printed part for aerospace or medical use runs around 26 months and binds the machine, the material batch specification and the parameter set together, so changing any one of them restarts a substantial part of the process. The root cause is that additive processes have more variables affecting material properties than casting or machining, and regulators reasonably require evidence for each. Commercially this blocks adoption and then protects whoever completed it. Suppliers mitigate through pre-qualified material and parameter packages that shorten customer certification substantially. It blocks entry and then defends the position.
Market Impact: Materials are 38% of revenue

Machines Sit Idle Most of the Time They Are Owned

Industrial printers spend roughly 31% of available hours actually building, and the remainder is setup, powder handling, post-processing bottlenecks and simply waiting for work. The root cause is that most owners bought capacity for peak prototyping demand and have no production programme to fill the gaps. Commercially this suppresses repeat machine sales, since a customer running at 31% has no reason to buy another. Suppliers mitigate by selling capacity through bureaus, improving automated powder handling and pursuing production programmes that fill machines. Customers running a third of the time never buy a second machine.
Market Impact: Entry pricing fell by 78%
3 additional market trends, 4 additional growth drivers, and 2 additional restraints and challenges are covered in the full report. Contact sales@marketmindsadvisory.com to access the complete intelligence.

Segment CAGR and Growth Architecture

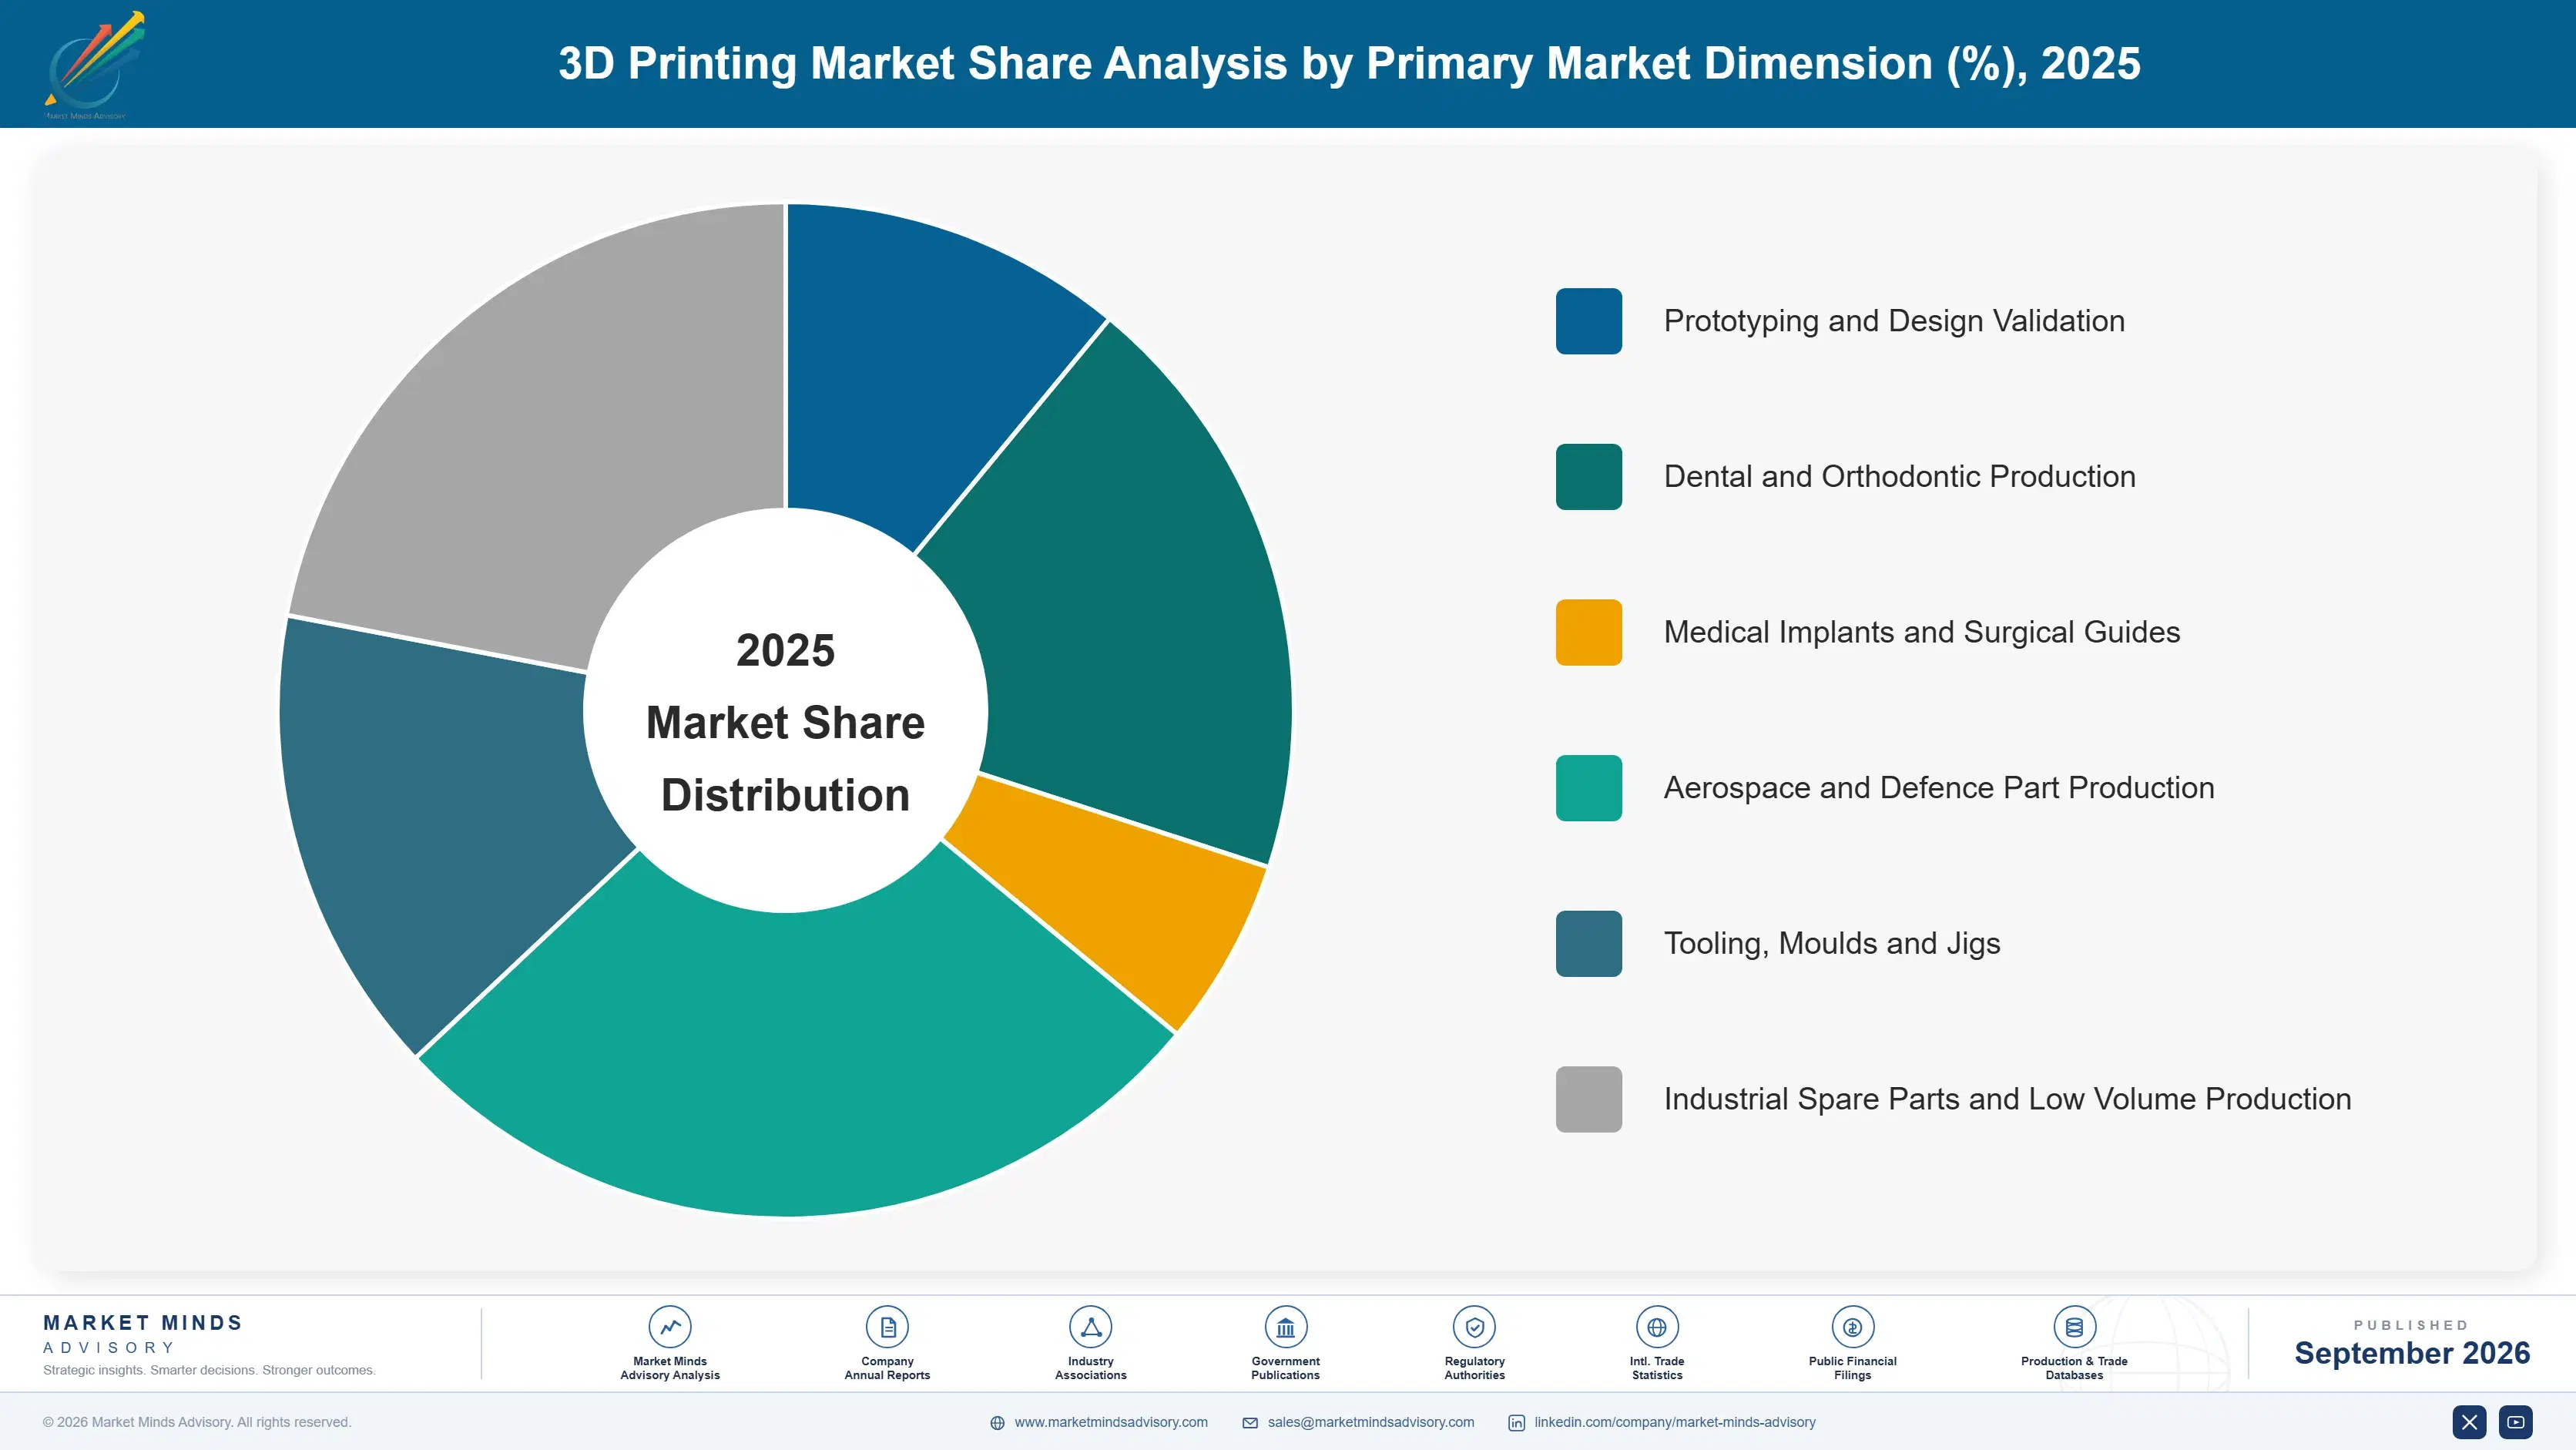
Segmentation follows the application, because prototyping, regulated production and tooling behave as separate industries with different buyers, different qualification burdens and different consumable intensity. Machine time alone reveals nothing useful, since a printer validating designs and a printer producing certified implants share very little beyond the underlying process. Consumable intensity differs enormously between them.
3d-printing-market-market-share-analysis-1788423649547

Dental and Orthodontic Production

Dental production grows fastest at 12.9%, half again the market rate of 8.6%, and it accounts for 44% of production part volume across the whole industry. Clear aligner treatment requires a unique mould for each patient at each stage, which conventional tooling cannot supply at any economic price, so this is the rare application where additive manufacturing has no competing method rather than a cost advantage over one. Demand follows aligner treatment volumes rather than manufacturing conditions. It also concentrates among a handful of very large producers running enormous printer fleets, which gives those customers pricing power over machine and materials suppliers that no other segment approaches. Machine and materials suppliers negotiate from weakness here.
CAGR 12.9%

Medical Implants and Surgical Guides

Implant production grows at 11.4% on a genuine engineering advantage: porous lattice structures that encourage bone integration cannot be machined or cast, and patient-specific implant geometry has no conventional equivalent. Regulatory approval binds machine, material and parameters together, which takes considerable time and then protects the position for years afterwards. Surgical guides are a simpler and faster-growing adjacent use, printed per procedure from imaging data. The buyer is a device manufacturer or increasingly a hospital with in-house capability, and the economics rest on clinical outcome and inventory reduction rather than on part cost comparisons. Hospitals with in-house printing capability are an emerging buyer group with quite different procurement behaviour and considerably smaller volumes per site.
CAGR 11.4%
Full segment breakdown across 6 segments available in the complete report.

Regional Architecture and Country Demand Map

Value follows production applications while unit shipments follow machine manufacturing, and the two sit in different places. Regions with dental, medical and aerospace production earn most of the revenue even where far fewer machines are built or sold. Unit share and value share diverge sharply.

North America

North America holds 34%, above the regional band, on production applications rather than machine manufacturing: the largest clear aligner producers, the deepest orthopaedic implant industry and most aerospace part qualification activity all sit here, and those carry far higher revenue per machine than prototyping does. Service bureau capacity is the most developed anywhere. Regulatory pathways for printed medical devices are better established than elsewhere, which shortens qualification relative to other markets. Machine building is a much smaller activity than machine buying, and a growing share of installed hardware is manufactured elsewhere entirely. Regional growth at 7.8% is modest because the base is mature and prototyping demand, which dominates machine time, has stopped expanding.
Share: 34% | CAGR: 7.8% (2026 to 2036)

East Asia

East Asia builds far more additive machines than any other region and ships considerably more units, though at prices that place its value share below its unit share. Chinese manufacturers took the desktop and light industrial market almost completely on price and adequate quality, and are now moving into metal systems. Japanese and Korean adoption concentrates in industrial tooling and electronics applications with careful qualification practice. Regional growth at 9.8% runs ahead of the market on domestic industrial adoption rather than on export, and dental production is expanding quickly across Chinese and Korean laboratories. Regional growth at 9.8% therefore reflects domestic adoption more than the export machine business that unit share statistics emphasise.
Share: 28% | CAGR: 9.8% (2026 to 2036)
Regional intelligence for 5 additional markets available in the complete report: Western Europe, South Asia and Pacific, Latin America, Middle East and Africa, Eastern Europe. Contact sales@marketmindsadvisory.com.
3d-printing-market-country-cagr-analysis-1788423650065

Where This Industry Makes Money

Machines have never been profitable to sell and prototyping revenue does not compound. What earns is the powder and resin that recurs with every build, the qualification packages that shorten a customer's two year certification, and the handful of applications where geometry leaves no alternative method. Machines have never been the business. Nobody earns selling printers.

Protect Consumable Revenue Over Machine Volume

Materials are 38% of industry revenue, recur with every build and carry margins that machine sales have never matched, since a printer sells once and then sits at 31% utilisation on the customer's balance sheet. Manufacturers qualifying materials to their own machines retain roughly 4 times the lifetime revenue of those running open material strategies. Customers dislike it and buy anyway, because switching materials on a qualified process restarts validation. Open platforms win machine sales and forfeit exactly the revenue that makes an installed base worth holding. The installed base only matters if it consumes.
Market Impact: Retains 4 times the lifetime account revenue overall

Sell Pre-Qualified Material and Parameter Packages

Certifying a printed part for regulated production takes around 26 months and binds machine, material and parameters together, which is the single largest barrier to production adoption in aerospace and medical work. Suppliers providing pre-qualified packages with documented property data shorten customer certification by roughly 9 months and win programmes on that basis rather than on machine specification. The work is testing and documentation rather than engineering. It is also the clearest way to convert a prototyping customer into a production one, which almost nothing else achieves. Documentation converts prototyping users into production ones.
Market Impact: Shortens the customer certification by roughly 9 months

Target Geometry Nobody Else Can Produce

Applications where additive manufacturing competes on cost against machining or moulding are lost more often than won, and always will be at 31% utilisation. Applications where the geometry has no conventional equivalent, including per-patient dental moulds, porous implant lattices and conformal cooling channels, have no competing method at all. Those segments grow at 12.9%, 11.4% and 9.0% respectively while cost-competitive applications stagnate. Suppliers organised around geometric necessity rather than cost comparison win considerably more often, and the sales conversation is entirely different. Cost comparisons are lost before they begin. Geometric necessity is a different conversation entirely, and it wins.
Market Impact: Two segments now growing at 12.9% and 11.4%

Sell Capacity Rather Than Machines to Low Volume Users

A customer running at 31% utilisation has no reason to buy a second machine and every reason to resent the first, which is why repeat industrial sales have been so weak across the industry. Bureau capacity sold per part converts that customer into recurring revenue without asking them to own idle equipment, and it fills machines the supplier or a partner already runs. Bureau revenue per customer runs around 2 times what an equivalent machine sale generates over a comparable period. It requires operating capability that machine builders have generally avoided developing.
Market Impact: Generates 2 times the machine sale revenue instead

Who Controls the Margin Pool

Concentration is very low at roughly 26% across the top five on measured hardware, materials and services revenue, and the field spans companies with almost nothing in common. Machine builders compete on process capability and have struggled to earn. Materials producers supply powders and resins across competing platforms and earn well. Service bureaus sell parts rather than equipment. The aggregate figure describes a category boundary rather than a competitive contest.
Competition runs on three dimensions. Materials qualification is first, because a closed material strategy determines whether an installed base generates recurring revenue or merely depreciates. Second is production application depth, particularly in dental and medical where volume concentrates. Third is price at the entry end, where low-cost manufacturers have taken the segment that traditionally introduced customers to the industry.

Two pressures are reshaping the field. Low-cost machines have removed the entry market and with it the traditional path to industrial customers, forcing established vendors to compete at the top directly. Meanwhile large dental producers have accumulated enough purchasing volume to dictate terms to machine and materials suppliers alike. Rankings will move toward participants with consumable positions and production application depth rather than those with the broadest machine range.
3d-printing-market-company-positioning-matrix-1788423650592

Competitive Moat and Risk Dimensions

STRATASYS

Moat: Installed base and materials attachment

Stratasys holds one of the largest industrial installed bases with materials qualified to its own machines, which converts hardware already placed into recurring consumable revenue at margins the machines themselves never produced. Long presence in aerospace and medical prototyping gives it qualification relationships that newer entrants cannot replicate quickly. Polymer process breadth serves customers whose applications span several technologies.
STRATASYS

Risk: Limited metal production position

The company's strength sits in polymer processes serving prototyping and tooling rather than in metal production applications where aerospace and medical part qualification concentrates. Entry-level polymer machines from low-cost manufacturers have also removed the segment that historically introduced customers to the range. Growth depends on converting prototyping users into production customers, which qualification makes slow.
EOS

Moat: Metal process and qualification depth

EOS holds deep positions in metal laser powder bed fusion where aerospace and medical part production concentrates, with parameter sets and material data supporting customer qualification programmes that take years to complete. Those qualifications bind the customer to the platform for the life of the certified part. Its process control credibility carries weight with regulators and certification bodies.
EOS

Risk: Metal machine demand cyclicality

Metal system sales follow industrial capital cycles and aerospace programme timing, both of which sit outside the company's influence and have been weak. Chinese metal machine manufacturers are improving quickly and competing on price in applications where qualification burdens are lighter. Utilisation near 31% also means existing customers have limited reason to add capacity.

Players Tracked

Prominent Players

Stratasys
3D Systems
HP
EOS
Nikon SLM Solutions

Other Key Players

Desktop Metal
Markforged
Formlabs
UltiMaker
Bambu Lab
Creality
Farsoon Technologies
Bright Laser Technologies
TRUMPF
Colibrium Additive
Renishaw
Carbon
Materialise
Protolabs
Prusa Research

Recent Developments

FEBRUARY 2025

Low-cost manufacturers extend into light industrial machine categories

Manufacturers that took the desktop market on price released machines targeting light industrial prototyping applications at a fraction of established pricing. The products were organic development rather than acquisitions, and quality reached levels that satisfy most design validation requirements adequately. Established vendors did not respond on price at all.
Signal: The entry route that introduced customers to this industry has closed, and established vendors must now win industrially.
JULY 2025

Large dental producers renegotiate machine and materials supply terms

Clear aligner manufacturers operating very large printer fleets renegotiated pricing with machine and materials suppliers, using volume that no other customer segment approaches. The discussions concerned unit economics rather than any change in technology or supplier relationships themselves. Fleet sizes at those producers exceed anything elsewhere in the industry.
Signal: Volume concentration in dental has handed a small number of customers pricing power over most of this industry.
OCTOBER 2025

Suppliers expand pre-qualified material and parameter packages

Machine manufacturers extended documented material property datasets and locked parameter sets aimed at shortening customer qualification for regulated production. The packages target aerospace and medical customers facing certification programmes measured in years rather than months. Property datasets accompanied each package, with locked parameters and documented test evidence for regulatory submission.
Signal: Qualification support is now the clearest route from prototyping customer to production customer that anybody has found.

What Printed Parts Actually Cost

Cost structure differs completely between machines, materials and printed parts. Machine manufacturing is dominated by lasers, optics, motion systems and build chambers at roughly 58% of cost of goods. Materials production is dominated by feedstock and atomisation for metal powders, running between 41% and 63% depending on alloy. Printed part cost at a bureau is dominated by machine depreciation at 31% utilisation, powder, and post-processing labour that customers consistently underestimate.
Metal powder pricing has been the sharpest input pressure. Titanium and nickel alloy powder costs track aerospace demand and feedstock availability, and both tightened through 2024 and 2025 as aerospace production rates recovered. Materialise and Protolabs both referenced materials and operating cost conditions in recent annual reporting. Bureaus quoting fixed part prices across long programmes absorbed the increase, since customers rarely accept material indexation on printed parts.

Exposure varies by position rather than by scale. Machine builders carry component supply and capital cycle risk with revenue that swings violently. Materials producers pass feedstock movement through and hold margin, provided their qualification position protects the customer relationship. Bureaus carry depreciation, powder and labour simultaneously, the worst combination at low utilisation. Small bureaus lack both programme volume and purchasing scale.
3d-printing-market-cost-volatility-analysis-1788423650786

Index powder cost into long part supply agreements

Metal powder pricing tracks aerospace feedstock demand that no bureau influences, and fixed part prices across multi-year programmes transfer that exposure entirely to the party least able to absorb it. Indexation against published alloy pricing moves it to customers already buying metal. Buyers resist it on printed parts, which is why the structure must be set at programme award.

Automate powder handling and post-processing first

Machine utilisation near 31% is limited more by setup, powder handling and post-processing than by build time itself, and adding printers does nothing about any of it. Automating those steps raises utilisation by roughly 18 percentage points on the same equipment, cheaper than buying capacity. It is unglamorous investment that competes against visible machine purchases and usually loses.

Qualify a second powder source before programme award

Certified production binds a specific material specification to the qualified process, which means a single powder source becomes an absolute dependency once a part is approved. Qualifying an alternative during the original certification costs incremental testing and removes an exposure that cannot be fixed later. Few do this, and those who have not discover the problem when terms change.

Portfolio Architecture for Margin Defence

Margin architecture in this industry has been consistently misread. Machines carry high revenue per unit and thin margins, compete against low-cost entrants and sell once to a customer running them at 31% utilisation. Materials carry 38% of revenue, recur with every build and earn considerably better, particularly where qualification binds a customer to one specification. Service bureaus earn steadily and carry the depreciation everyone else avoided.
The volume tension is between prototyping breadth and production depth. Prototyping reaches almost every manufacturer, uses 54% of machine time and generates revenue that does not compound because each project ends. Production applications reach far fewer customers, require qualification measured in years and produce recurring part volumes that continue for a programme lifetime. Suppliers built around prototyping found that a large customer count never became a large revenue base.

High-value revenue concentrates in qualified materials for regulated production and in dental and medical part volumes. Both share the property that the customer cannot substitute without restarting a certification or losing a geometric capability that has no alternative. Machine sales occupy the volume position, provide the installed base that materials revenue depends upon, and have made very little money for anybody across this industry's history.

Volume / Commodity-Adjacent

Machine sales into prototyping and light industrial applications. The wide range separates established industrial systems from entry machines competing directly against low-cost manufacturers. Repeat purchase is weak because customers run existing equipment at low utilisation.
Gross Margin: 24-38%

Premium / Certified

Service bureau part production and industrial metal systems for tooling and low volume manufacturing. Margin depends heavily on utilisation, which most operators struggle to hold above a third. Post-processing labour is the line that most often erodes the quoted economics.
Gross Margin: 36-52%

Sustainability / Regulatory / Next-Generation

Qualified materials for regulated production, dental and medical part supply, and certification support packages. The widest range in the portfolio, reflecting how much regulatory content accompanies the supply. Highest margin and the most protected by qualification barriers anywhere here.
Gross Margin: 51-72%
3d-printing-market-portfolio-architecture-1788423651292

High-value Sub-segments and Strategic Watch-out

Qualified Production Materials

High value and high growth together, because certified production binds machine, material and parameters and switching restarts a certification measured in years. The margin range reflects alloy and regulatory content. Recurring with every build makes this the only genuinely compounding revenue most participants in this industry hold.
Gross Margin: 58-72%

Dental and Medical Part Supply

High value with the strongest growth here, addressing geometry that conventional methods cannot produce at any economic price rather than competing on cost. The range reflects regulatory content by device class. Volume concentration among a few dental producers gives those customers unusual pricing power over suppliers.
Gross Margin: 47-63%

Prototyping Machine Sales

The volume core of unit shipments and the weakest part commercially, competing against low-cost manufacturers whose machines satisfy most design validation requirements. It provides the installed base that materials revenue depends on entirely. Nobody in this industry has earned adequately from selling printers. That has been true throughout its history.
Gross Margin: 22-36%

Low-Cost Manufacturer Encroachment

The strategic watch-out, carried at zero because it displaces established vendor revenue rather than generating any. Entry pricing has fallen far enough to remove the segment that traditionally introduced customers to industrial systems. Established vendors assuming quality gaps protect the industrial end are repeating what the desktop segment already disproved.
Gross Margin: 0-0%

How This Revenue Repeats

Recurrence depends entirely on whether a machine is making parts or validating designs. A printer in a production programme consumes material continuously for the life of that programme, which can run a decade in aerospace and considerably longer in dental. A printer in a design department consumes material sporadically, sits at 31% utilisation and generates unforecastable consumable revenue. The same equipment sold to two departments produces completely different lifetime economics.
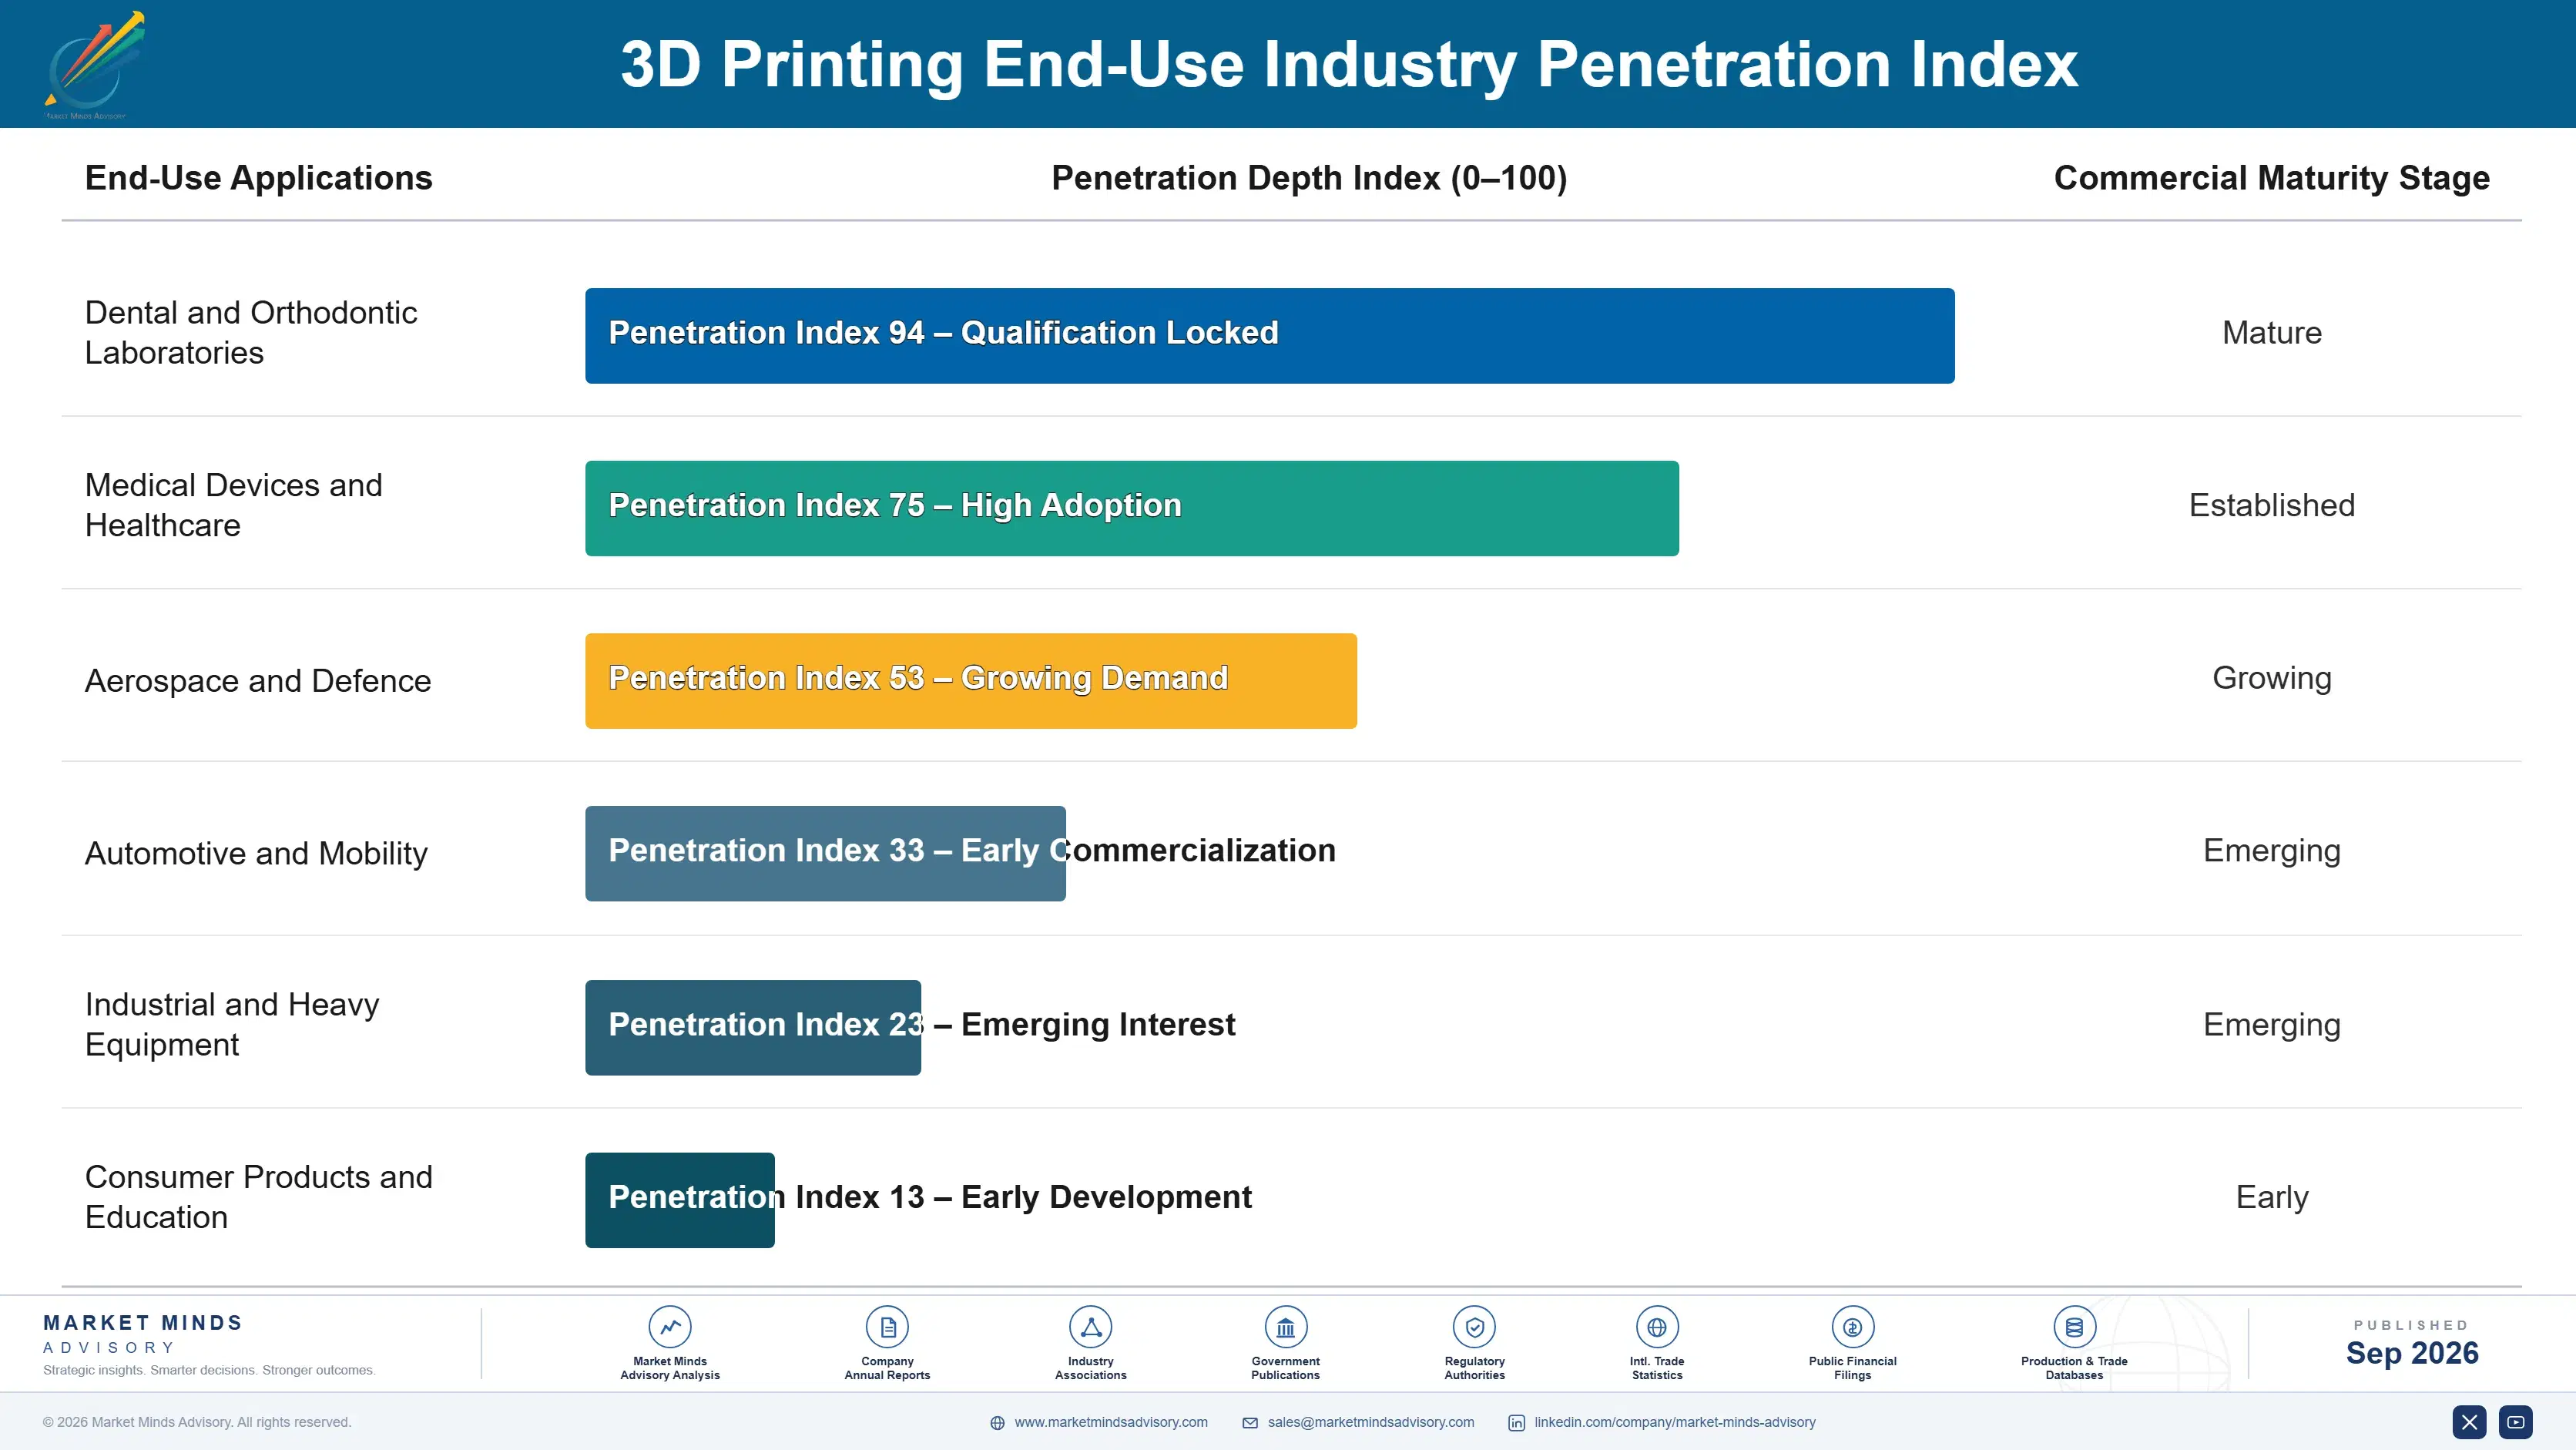
Adoption depth varies sharply by industry. Dental producers run fleets continuously and treat them as production equipment with a full maintenance regime. Medical device manufacturers use qualified processes narrowly for specific approved products. Aerospace uses it for a few qualified components and prototyping elsewhere. Automotive uses it almost entirely for prototyping and tooling work. Industrial spares users deploy it sporadically, when a part is unavailable rather than routinely.

The buyer profile splits rather than shifts. Prototyping machines are bought by engineering leadership on development cycle arguments with modest budgets. Production capability is bought by manufacturing operations against a qualified part programme with capital approval. Materials are bought by procurement against a specification that qualification has already locked. Suppliers organised around one relationship usually address the buyer whose spending never recurs.
3d-printing-market-end-use-penetration-index-1788423651783

Where This Industry Earns

These are among the four positions where our research anticipates prominent divergence between winners and laggards over the coming forecast period. Each is grounded in the demand model, the regulatory perimeter, and the announced capacity pipeline.
01 / CONSUMABLE POSITION DEFENCE

Protect the powder revenue, concede the machine margin

Materials represent 38% of industry revenue, recur with every single build and earn margins that machine sales have never once approached, since printers sell only once and then sit at roughly 31% utilisation on somebody else's balance sheet. Manufacturers that qualify materials to their own machines retain around 4 times the lifetime revenue of those running open platforms instead. Customers dislike the restriction and buy anyway, because switching material on a qualified process restarts a validation nobody wants to repeat.
02 / QUALIFICATION SUPPORT SELLING

Shorten the customer's certification, not your build time

Certifying a printed part for regulated production runs around 26 months and binds machine, material and parameter set together, which is the single largest obstacle to production adoption in aerospace and medical work. Suppliers providing pre-qualified packages with documented property data shorten that by roughly 9 months and win programmes on evidence rather than on machine specification. It is testing and documentation work rather than engineering, and it is the only reliable route from a prototyping customer to a production one.
03 / GEOMETRIC NECESSITY FOCUS

Sell where no conventional method exists at all

Applications competing on cost against machining or moulding are lost far more often than won, and always will be at current utilisation levels. Per-patient dental moulds, porous implant lattices and conformal cooling channels have no conventional manufacturing equivalent whatsoever, and those three segments grow at 12.9%, 11.4% and 9.0% respectively while cost-competitive applications stagnate. Suppliers organised around geometric necessity rather than cost comparison win considerably more often, and they hold an entirely different kind of conversation with the engineer evaluating them.
04 / CAPACITY OVER EQUIPMENT

Sell parts to customers who cannot fill a machine

A customer running at 31% utilisation has no reason to buy a second printer and considerable reason to regret the first, which is why repeat industrial machine sales have been so weak for so long. Selling bureau capacity per part converts that customer into recurring revenue without asking them to own idle equipment, and generates around 2 times what an equivalent machine sale produces over a comparable period. It requires operating capability that machine builders have consistently avoided developing themselves.

Engagement Snapshot From the Field

A live engagement with an industry participant carrying material or product regulatory and market exposure ahead of a defining policy shift, showing how our research translates into a defensible multi-year portfolio strategy.
MARKET MINDS ADVISORY · CLIENT ENGAGEMENT SUMMARY
3D Printing Producer Strategic Portfolio Review and Transition Roadmap 2026·Investment Scenario on 3D Printing Exposure Evaluation 2025-26
CLIENT PROFILE
An orthopaedic device manufacturer with annual revenue near USD 780 million (client-reported, unverified by MMA), operating fourteen metal additive machines that produced porous-structure implants across two approved product families. Machine utilisation across the installed fleet averaged just 34%, and a further eleven machines had been requested to support two additional product families then entering the approval process.
STRATEGIC CHALLENGE
The capital request totalled roughly USD 19 million and assumed each product family required dedicated machines to preserve qualification integrity (client-reported, unverified by MMA). Nobody had established whether qualification genuinely required dedicated equipment or whether that assumption had been inherited from the first approval programme without ever being tested against the actual regulatory requirement.
MMA APPROACH
MMA examined the qualification documentation for both approved families rather than the internal policy that had grown around it, establishing what the regulatory submissions actually bound together. We interviewed 14 internal stakeholders, three notified body advisers, two machine suppliers and one powder producer. Options were evaluated against qualification risk and utilisation rather than against machine count or nominal capacity requirements.
KEY FINDINGS
  1. Qualification bound the machine model, material specification and parameter set, but not individual machine serial numbers, which meant dedicated equipment per family had never been required.
  2. Utilisation at 34% was limited by powder handling and post-processing throughput rather than by build capacity, and additional machines would not have improved it.
  3. Post-processing was performed manually and represented roughly 41% of part cost, considerably above what the original investment business case had assumed at the outset.
  4. A single powder supplier held both approved specifications with no qualified alternative, creating a dependency nobody had assessed since the first approval.
CLIENT PROFILE
An orthopaedic device manufacturer with annual revenue near USD 780 million (client-reported, unverified by MMA), operating fourteen metal additive machines that produced porous-structure implants across two approved product families. Machine utilisation across the installed fleet averaged just 34%, and a further eleven machines had been requested to support two additional product families then entering the approval process.
STRATEGIC CHALLENGE
The capital request totalled roughly USD 19 million and assumed each product family required dedicated machines to preserve qualification integrity (client-reported, unverified by MMA). Nobody had established whether qualification genuinely required dedicated equipment or whether that assumption had been inherited from the first approval programme without ever being tested against the actual regulatory requirement.
MMA APPROACH
MMA examined the qualification documentation for both approved families rather than the internal policy that had grown around it, establishing what the regulatory submissions actually bound together. We interviewed 14 internal stakeholders, three notified body advisers, two machine suppliers and one powder producer. Options were evaluated against qualification risk and utilisation rather than against machine count or nominal capacity requirements.
KEY FINDINGS
  1. Qualification bound the machine model, material specification and parameter set, but not individual machine serial numbers, which meant dedicated equipment per family had never been required.
  2. Utilisation at 34% was limited by powder handling and post-processing throughput rather than by build capacity, and additional machines would not have improved it.
  3. Post-processing was performed manually and represented roughly 41% of part cost, considerably above what the original investment business case had assumed at the outset.
  4. A single powder supplier held both approved specifications with no qualified alternative, creating a dependency nobody had assessed since the first approval.
RECOMMENDED STRATEGY
Phase 1: Reduce the capital request to four machines and share qualified equipment across product families, since the regulatory submissions never required dedicated units. Phase 2: Invest the released capital in automated powder handling and post-processing, which is the actual constraint on both utilisation and part cost. Phase 3: Qualify a second powder source for both approved specifications now, before any supply or commercial change forces the question at a worse moment.
OUTCOME
The manufacturer purchased four machines rather than the eleven requested, and lifted utilisation to 58% within ten months through post-processing automation (client-reported, unverified by MMA). Part cost fell by roughly 22%, and a second powder specification completed qualification alongside the two new product family approvals.

Frequently Asked Questions

Foundational context covering the market sizes, CAGR, scope, country, region and competition that inform every finding below. This section is provided to cover basics and most often pre-purchase conversations, answered from the MMA Primary Research Dataset.

What is the current size of the 3D Printing Market?

The market was worth USD 21.5 billion in 2025 and reaches USD 23.35 billion in 2026. Materials account for 38% of that revenue and recur with every build.

How large will the 3D Printing Market be by 2036?

MMA forecasts USD 53.28 billion by 2036, an expansion of 2.28 times over the forecast period. That represents USD 29.93 billion of incremental annual revenue against 2026.

What is the CAGR for the 3D Printing Market 2026 to 2036?

The base case is 8.6% compound annual growth, with a bull case at 9.8% and a bear case at 7.4%. Whether qualification pathways shorten separates the three scenarios.

Which segment is growing fastest?

Dental and orthodontic production grows at 12.9%, half again the market rate of 8.6%. Per-patient aligner moulds have no conventional manufacturing equivalent at any economic price.

Who are the major companies in the 3D Printing Market?

Stratasys, 3D Systems, HP, EOS and Nikon SLM Solutions lead on measured hardware, materials and services revenue. Together they hold roughly 26% across a very fragmented field.

Which country is growing fastest?

India grows fastest at 13.2%, on manufacturing incentive programmes and a rapidly expanding service bureau base serving domestic and export customers alongside dental laboratory adoption.

Report Segmentation Architecture

The full report scope spans multiple orthogonal segmentation dimensions, with cross-tabulated demand data provided for each dimension pair. Coverage extends further to regional breakdowns, trend trajectories, and the competitive detail needed to support segment-level decision-making.

By Primary Market Dimension

  • Prototyping and Design Validation
  • Dental and Orthodontic Production
  • Medical Implants and Surgical Guides
  • Aerospace and Defence Part Production
  • Tooling, Moulds and Jigs
  • Industrial Spare Parts and Low Volume Production

By End-Use Industry

  • Dental and Orthodontic Laboratories
  • Medical Devices and Healthcare
  • Aerospace and Defence
  • Automotive and Mobility
  • Industrial and Heavy Equipment
  • Consumer Products and Education

By Commercial Dimension

  • Direct Machine Sales
  • Materials and Consumables Supply
  • Service Bureau Part Production
  • Distributor and Reseller Channels
  • Qualification and Certification Support
  • Managed Production Programmes

By Region

  • North America
  • East Asia
  • Western Europe
  • South Asia and Pacific
  • Latin America
  • Middle East and Africa
  • Eastern Europe

Scope, Methodology, and Coverage

Every figure in this report is reproducible from documented input assumptions. The scope below maps the historical period, the forecast horizon, the segmentation dimensions, and the countries covered, alongside the underlying primary and qualitative methodology.
Historical Period
2020 to 2025
Forecast Period
2026 to 2036
Base Year
2025 (USD billions; MMA Primary Research Dataset, September 2026)
Market Definition
This market covers additive manufacturing hardware, materials and services, spanning prototyping and design validation, dental and orthodontic production, medical implants and surgical guides, aerospace and defence part production, tooling, moulds and jigs, and industrial spare parts and low volume production. Revenue is measured as machine shipment value, materials and consumables supply, and service bureau part production at supplier level, including attributable qualification support services. Conventional subtractive machining, injection moulding and casting, design and simulation software sold standalone, construction-scale concrete and cementitious printing, and bioprinting for tissue applications are excluded.
Quantitative Units
USD billions, machine, materials and service revenue at supplier level
Segmentation Dimensions
Application, end-use industry, commercial channel, region
Regions Covered
North America, East Asia, Western Europe, South Asia and Pacific, Latin America, Middle East and Africa, Eastern Europe
Countries Covered
United States, Canada, Mexico, Brazil, Chile, Germany, United Kingdom, France, Italy, Netherlands, Belgium, Switzerland, Sweden, Spain, Poland, Czechia, Hungary, China, Japan, South Korea, Taiwan, Singapore, India, Australia, Vietnam, Thailand, Israel, United Arab Emirates, Saudi Arabia, South Africa
Key Companies Profiled
Stratasys, 3D Systems, HP, EOS, Nikon SLM Solutions, Desktop Metal, Markforged, Formlabs, UltiMaker, Bambu Lab, Creality, Farsoon Technologies, Bright Laser Technologies, TRUMPF, Colibrium Additive, Renishaw, Carbon, Materialise, Protolabs, Prusa Research
Quantitative Methodology
Primary survey, n=3,800 respondents, Q4 2025, six countries; demand-side model with trade association cross-validation
Qualitative Methodology
47 expert interviews, Q4 2025; applied to validate demand model assumptions, identify emerging dynamics, and assess competitive positioning
Report Format
PDF and XLSX data workbook (Word format preview document)
Publisher
Market Minds Advisory
Report Code
MMA-2026-CON-611
Published
September 2026
Contact
sales@marketmindsadvisory.com | www.marketmindsadvisory.com

Purchase the full 3D Printing Market Report (2026 to 2036).

The full MMA report separates what this industry actually earns from what it has spent fifteen years describing, and follows the money to consumables, dental production and qualification support. It sizes the market to 2036 across six applications, seven regions and 30 countries, with segment growth rates and regional demand mechanisms set out in full. Competitive analysis covers 20 participants assessed on measured hardware, materials and services revenue, including moat and risk assessment for the two leaders. The report quantifies cost structure by position, utilisation economics and margin architecture across three portfolio tiers. It closes with four strategic verdicts and an anonymised orthopaedic manufacturer engagement.
Six additive applications sized to 2036
Seven regions with demand mechanism analysis
Twenty participants on consistent revenue basis
Utilisation, qualification and materials cost benchmarks
Margin architecture across three portfolio tiers
Anonymised orthopaedic additive production strategy engagement

Built For The People Who Decide

From boardroom strategy to bench-side execution, this report is read cover-to-cover by leaders shaping the next decade of their industry, turning demand scenarios, market dynamics and valuation benchmarks into decisions.
CXOs/ Presidents/ VPs/ Managers
M&A and Corporate Development
Strategy Teams and R&D Heads
Procurement and Product Directors
Regulatory and Compliance Leaders
Investor Relations and Equity Analysts