Market Minds Advisory
3D Printed Prosthetics Market

3D Printed Prosthetics Market: Two Businesses Counted As One

In reimbursed markets printing is a productivity tool inside a clinic that already works. Where no prosthetist exists it is the only route to a device at all. Those are not the same market.

Lead Analyst

Published

September 2026

Make Smarter Decisions with Customized Research Insights

Request a free sample report and evaluate market opportunities, growth trends, and competitive dynamics relevant to your business needs.

2025 MARKET VALUE$1.1BMarket Size 2025
2036 FORECAST VALUE$4.0BBase Case , 2026 to 2036
CAGR 2026 TO 203612.4 %Bull 13.7% / Bear 11.1%
INCREMENTAL OPPORTUNITY$2.7BNet 10- year value creation
EXPANSION MULTIPLE3.22x2036 value over 2026 base
Strategic Levers
M&A Pipeline
Regional Outlook
Country Rankings
Competitive Intelligence
Segmental Deep-dive
Call-Us : 91 93563 13602

Executive Snapshot and Market Trajectory

A prosthetic limb fails at the socket, not at the knee or the hand. Fitting one is a craft skill, and printing does not replace the skill. It replaces the fabrication, which matters enormously in places with no prosthetist at all. The market reaches USD 1.1 billion in 2025.
Custom sockets and interfaces grow fastest at 18.6%, exactly 1.50 times the market rate, because that is where the device either works or does not and where digital fabrication saves the most time. North America holds 30% of value on reimbursement rather than on need. South Asia and Pacific takes 15%, above the band this framework applies, on unmet demand conventional fabrication was never going to reach.
Concentration reaches 47% across the top five, where the established prosthetics manufacturers still lead a field that digital entrants keep predicting they will disrupt entirely. Competition turns on scanning and design software, on how well it fits into an existing clinician workflow, and on reimbursement coding relationships. Roughly one in ten people worldwide who need prosthetic care actually receive any, and that gap has never once been a technology problem in the first place.
Market Definition
The 3D printed prosthetics market covers externally worn prosthetic devices and components produced by additive manufacturing, spanning custom sockets and interfaces, upper limb and terminal devices, lower limb structural components, facial and cranial prosthetics, and covers and cosmesis. Dental prosthetics and crowns, orthopaedic implants including joint replacements, orthoses and braces, conventionally fabricated prosthetics, and the printers and materials sold as general equipment are excluded.
Base Year Value
$1.1B in 2025 (MMA Primary Research Dataset, August 2026)
Forecast Period
2026 to 2036, eleven discrete annual values
CAGR
12.4% base case. Bull 13.7%. Bear 11.1%.
Fastest Growth Segment
Custom Sockets and Interfaces: 18.6% CAGR
Fastest Growth Country
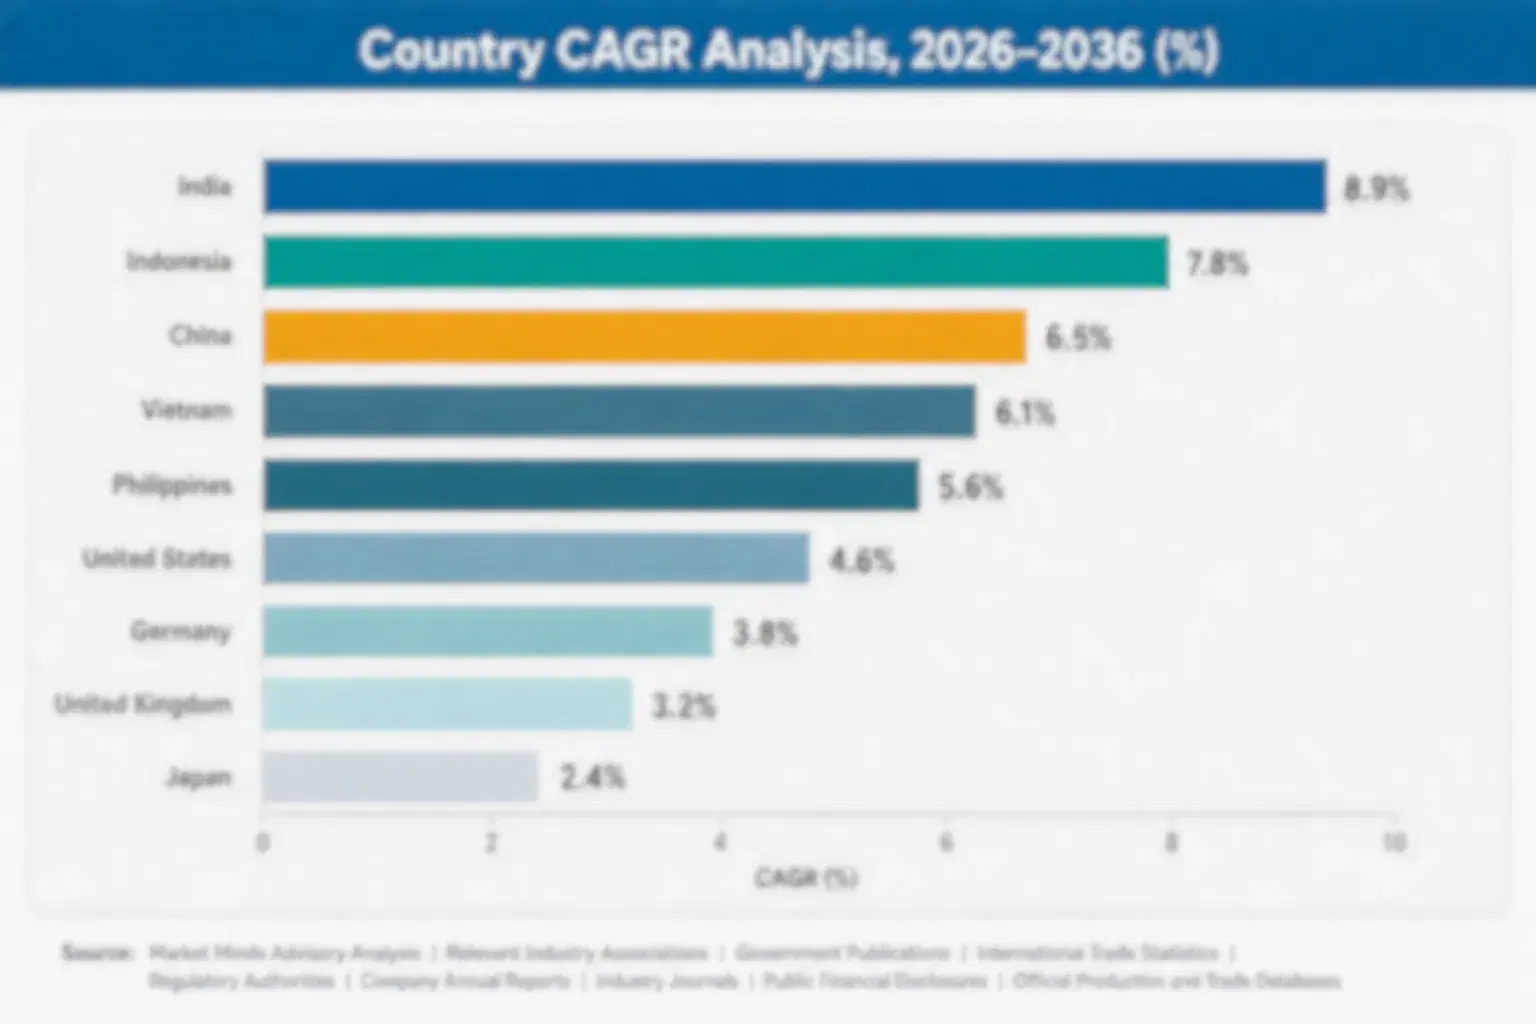
India: 16.8% CAGR
Fastest Growth Region
South Asia and Pacific: 14.6% CAGR
Largest Region
North America: 30% of 2025 global value
Market Leaders
Ottobock, Ossur, Blatchford, Fillauer, Proteor. Source: MMA Primary Research Dataset, July 2026.
Primary Survey
n=3,800 procurement and R&D decision-makers, Q4 2025, six countries
Methodology
Demand-side build-up, cross-validated against public data, 47 expert interviews

3D Printed Prosthetics Market Forecast Scenarios

3d-printed-prosthetics-market-size-forecast-scenario-1786463176767
Between 2020 and 2025 additive fabrication moved from demonstration into clinical routine, though considerably more slowly than its advocates expected. Established manufacturers adopted printing inside existing workflows to cut fabrication time, while humanitarian and low-cost programmes proved that devices could be produced where no prosthetist practised. Reimbursement coding lagged throughout. An 11.2% historical CAGR reflects adoption inside clinics rather than any expansion of who gets treated.
Three mechanisms carry the 12.4% base case. Socket fabrication productivity is the largest, since printing removes days of hand lamination from a process that needs three trial fittings anyway. Underserved population access is the second, growing fastest in absolute terms and slowest in value because devices there cost a fraction of a reimbursed one. And diabetes-driven amputation is the third, rising steadily across every region and adding demand nobody wants.
The 13.7% bull case turns on reimbursement systems creating codes for digitally fabricated devices, which would remove the awkwardness clinics currently face in billing for something faster and cheaper. The 11.1% bear case is that same reimbursement structure holding, since a clinic paid per device has no financial reason to adopt a method that reduces what it can charge for fabrication.

The Socket Is The Whole Problem

Almost every prosthesis that gets abandoned is abandoned because of the socket. The knee, foot, or hand is engineering that works reliably, while the socket is the part that touches a residual limb which changes volume through the day, changes shape over months, and hurts if any of it is wrong. Getting that interface right takes a certified prosthetist and typically three trial fittings.
TOP FIVE CONCENTRATION47%Established manufacturers still lead a field digital entrants keep contesting
SOCKET FITTING ITERATIONS3Trial sockets typically required before a definitive fit is achieved
DEVICE COST REDUCTION62%Saving against a conventionally fabricated equivalent of comparable function
GLOBAL AMPUTEE COVERAGE10%Share of people needing prosthetic care who actually receive it
DIGITAL FABRICATION SHARE23%Share of new sockets produced additively rather than laminated
FITTING TURNAROUND5 daysTime from scanning through to delivery of a printed socket
Printing does not remove that skill and the industry has largely stopped pretending that it does. What it removes is the fabrication: days of plaster casting, hand lamination, and vacuum forming compress into a scan, a design session, and a print. In a German or American clinic that is a productivity gain inside a process that already worked perfectly well.
Somewhere without a prosthetist at all it becomes a completely different proposition entirely. Roughly one in ten people worldwide who need prosthetic care receive it, and the shortage is of trained clinicians far more than of devices. Printing plus remote design lets one prosthetist serve many more patients, which is the only mechanism anybody has found that changes that ratio at all.
"People show me printed hands at conferences. Nobody abandons a prosthesis because the hand was disappointing. They abandon it because the socket hurt after forty minutes, and no printer has ever solved that on its own."
Director, Rehabilitation Technology Practice · MMA Medical Devices Practice

Market Trends

Remote Design Separates Fitting From Fabrication

Scanning a residual limb no longer requires the person who designs the socket to be in the room, which breaks a constraint that has shaped prosthetic care since it began. A technician or trained assistant captures the geometry, a prosthetist anywhere designs against it, and the device prints near the patient. That lets scarce clinical expertise serve a far larger population without anybody travelling. Programmes across South Asia and East Africa now run on this model, and it is the only approach that meaningfully changes the one-in-ten coverage figure. Nothing else has moved that number at all.
Market Impact: Diabetes causes 60% of amputations
Reimbursement Coding Has Not Caught Up With Method

Payment systems in most developed markets reimburse prosthetic devices against codes written around conventional fabrication, with the labour of casting and lamination built into the assumed cost. A clinic that prints a socket in a fraction of the time bills against a code that assumes it did not. Some payers have begun questioning charges where the method has obviously changed, which creates an awkward incentive to keep doing things the slow way. Until coding recognises digital fabrication explicitly, adoption in reimbursed markets will keep running behind the technical case. Nobody bills faster work at the same rate comfortably.
Market Impact: Costs fall 62% against conventional

Market Opportunities and Growth Drivers

Diabetes Is Driving Amputation Rates Steadily Upward

Lower limb amputation following diabetic foot complications has risen across every region as diabetes prevalence has climbed, and it is now the largest single cause of limb loss in most developed health systems and increasingly in developing ones. These patients are typically older, frequently have vascular complications, and need sockets that accommodate volume changes and fragile tissue. Demand grows regardless of anything happening in prosthetic technology or health policy. It is unwelcome demand and it is the most reliable growth mechanism in this market. Health policy cannot slow it and technology cannot accelerate it.
Market Impact: Only 1 in 10 receive care

Printed Devices Cost A Fraction Of Conventional Ones

A printed socket and componentry can deliver comparable function at roughly 62% below a conventionally fabricated equivalent, mostly through removing skilled fabrication hours rather than through any cheaper materials. In a system that pays for devices that difference is purely a margin question. Where families pay directly, which is most of the world by population, it decides whether the device gets bought at all. Adoption curves in the two settings look nothing alike, because price decides everything in one of them and almost nothing in the other. Established manufacturers have never seriously attempted the second of those two markets.
Market Impact: Fatigue data covers 5 years only

Market Restraints and Challenges

Clinician Shortage Constrains Absolutely Everything Downstream

Fitting a socket well remains a craft skill requiring certified training, and the global shortage of prosthetists is severe enough that roughly nine in ten people needing care never receive it. The root cause is that training programmes are few, concentrated in wealthy countries, and produce graduates who mostly stay there. Commercially this caps how fast printed devices can reach anybody, because a printer without a prosthetist produces a socket that hurts. Participants are mitigating through remote design workflows, technician-level scanning training, and software that encodes part of the fitting judgement.
Market Impact: One prosthetist serves 4 times more

Printed Structural Components Face Durability Doubts

Clinicians remain cautious about printed load-bearing components, because a socket carrying full body weight through thousands of cycles daily fails differently from a laminated one and the failure data is still thin. The root cause is genuine: layer adhesion and anisotropy behave differently under fatigue, and the long-term evidence base is younger than the devices it needs to cover. Commercially this slows adoption in lower limb structural parts specifically. Mitigation runs toward continuous fibre reinforcement, published fatigue testing to recognised standards, and hybrid designs printing the interface while keeping conventional structural elements.
Market Impact: Coding lags method by 10 years
3 additional market trends, 2 additional growth drivers, and 4 additional restraints and challenges are covered in the full report. Contact sales@marketmindsadvisory.com to access the complete intelligence.

Segment CAGR and Growth Architecture

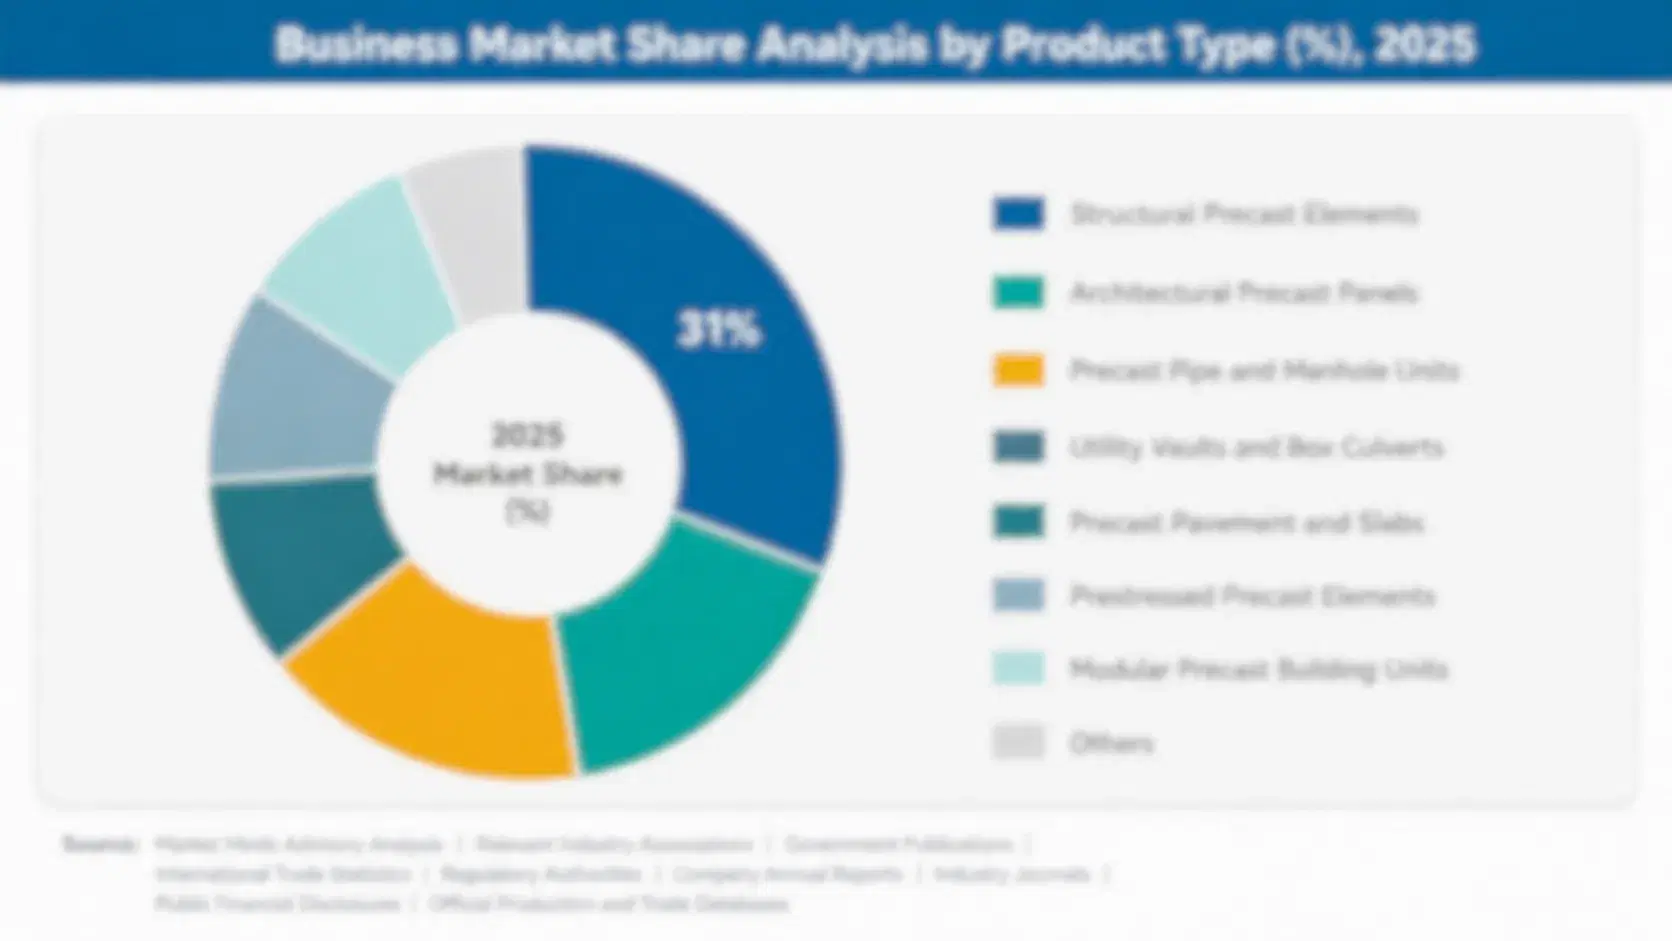
Segmentation follows prosthetic component, because each part of a device faces a different problem: the socket must fit a changing body, structural parts must survive fatigue loading, and terminal devices must do useful work. Each carries its own regulatory treatment, durability evidence requirement, and clinical decision maker. Material and printing process are handled in the framework instead.
3d-printed-prosthetics-market-market-share-analysis-1786463176929

Custom Sockets and Interfaces

Sockets grow fastest at 18.6%, exactly 1.50 times the market rate, because this is the component that decides whether a prosthesis gets worn or abandoned in a cupboard. Every socket is bespoke to a residual limb that changes volume through the day and shape over months, so there was never a mass-produced alternative to displace. Printing removes the plaster casting, hand lamination, and vacuum forming, compressing days into a scan and a print while leaving the clinical judgement exactly where it was. Three trial fittings are still typical. The gain is fabrication time and cost, and in underserved regions that gain is the difference between a device existing and not.
CAGR 18.6%

Upper Limb Devices and Terminal Devices

Upper limb devices grow at 15.1%, and they attract far more attention than their share of the market justifies. Printed hands and terminal devices photograph well, cost a small fraction of conventional myoelectric alternatives, and have driven most public awareness of prosthetic printing through charitable and open-source programmes. Clinical adoption is real but narrower, because upper limb amputation is much less common than lower limb and rejection rates for any prosthetic hand remain stubbornly high. Paediatric fitting is the genuine strength, since children outgrow devices annually and printing makes replacement affordable in a way conventional fabrication never did. Replacement every year turns a single fitting into a decade of repeat business that conventional fabrication had priced out of reach.
CAGR 15.1%
Full segment breakdown across 5 segments available in the complete report.

Regional Architecture and Country Demand Map

Regional shares here follow who pays rather than who needs a prosthesis, and the two diverge sharply. Reimbursed markets carry most of the value on a fraction of the patients, while regions with the largest unmet need contribute volume at device prices a tenth as high.

North America

North America holds 30% of value on reimbursement rather than on population need, which is the pattern across every developed market here. Medicare and private insurance pay for prosthetic devices at prices that sustain a large clinical network, and diabetes-driven lower limb amputation generates steady and rising demand across an ageing population. Adoption of printing is real but incremental, running inside clinic workflows as a fabrication productivity gain rather than changing who receives care. Coding that still assumes conventional fabrication creates an awkward incentive against moving faster. Growth at 11.4% trails the global rate because coverage here is already close to complete. Value density here is the highest anywhere. Patient numbers are not.
Share: 30% | CAGR: 11.4% (2026 to 2036)

South Asia and Pacific

Fastest growth sits in South Asia and Pacific at 14.6%, on 15% of global value against a 12% ceiling in this framework, and unmet need explains the breach. India alone has an amputee population in the millions against a prosthetist workforce numbering in the hundreds, and conventional fabrication was never going to close that gap at any price. Printing combined with remote design lets scarce clinical expertise cover far more patients, and organisations across India, Indonesia, and the Philippines run programmes on exactly that model. Device prices sit at a fraction of reimbursed markets, so unit growth substantially exceeds value growth here. Unit growth substantially exceeds value growth in every year forecast.
Share: 15% | CAGR: 14.6% (2026 to 2036)
Regional intelligence for 5 additional markets available in the complete report: Western Europe, East Asia, Latin America, Middle East and Africa, Eastern Europe. Contact sales@marketmindsadvisory.com.
3d-printed-prosthetics-market-country-cagr-analysis-1786463177097

Where Printed Prosthetics Money Actually Sits

Selling printers into prosthetics clinics is a small and largely finished business already. The money is in the software that captures clinical judgement so a technician can do part of a prosthetist's job, in devices sized for markets that pay directly, and in getting reimbursement codes written around digital fabrication rather than against it.

Encode The Fitting Judgement Into Software

The binding constraint is prosthetists rather than printers, and design software that carries rectification rules, volume accommodation, and pressure tolerance lets one clinician oversee roughly four times the caseload. That is the only lever that touches the one-in-ten coverage figure at all. Sold as a subscription per clinician it earns USD 6,000 to USD 18,000 annually at software margins, and it locks the workflow because a service redesigned around one platform is not casually rebuilt on another. Printers are not the constraint and never were. Certified clinicians are. Printers were never the binding constraint.
Market Impact: Subscriptions earn 6,000 to 18,000

Build A Deliberately Different Device For Direct-Pay Markets

A device engineered for German reimbursement and then discounted for India satisfies nobody, because the cost structure was set by requirements that market does not share. Designing from the price point upward, at roughly 62% below conventional cost, reaches populations that were never going to be customers otherwise. Volumes are large and margins per device are thin, which suits a supplier organised for it and destroys one that is not. Very few established manufacturers have genuinely tried this. Established manufacturers risk undermining reimbursed pricing by trying. That conflict has kept them out.
Market Impact: Direct-pay devices price 62 percent

Get Digital Fabrication Into Reimbursement Coding

Payment codes written around plaster casting and hand lamination create an incentive to keep doing things slowly, and clinics that print are billing against assumptions that no longer hold at all. Working with payers to establish codes recognising digital fabrication removes that awkwardness and legitimises adoption across an entire national system at once, across markets carrying roughly 30% of global value. It takes evidence submissions and years of engagement, and the supplier that leads it shapes definitions worth far more than any individual product advantage. Definitions written now will govern the market for decades.
Market Impact: Coding affects 30 percent of all gl

Who Controls the Margin Pool

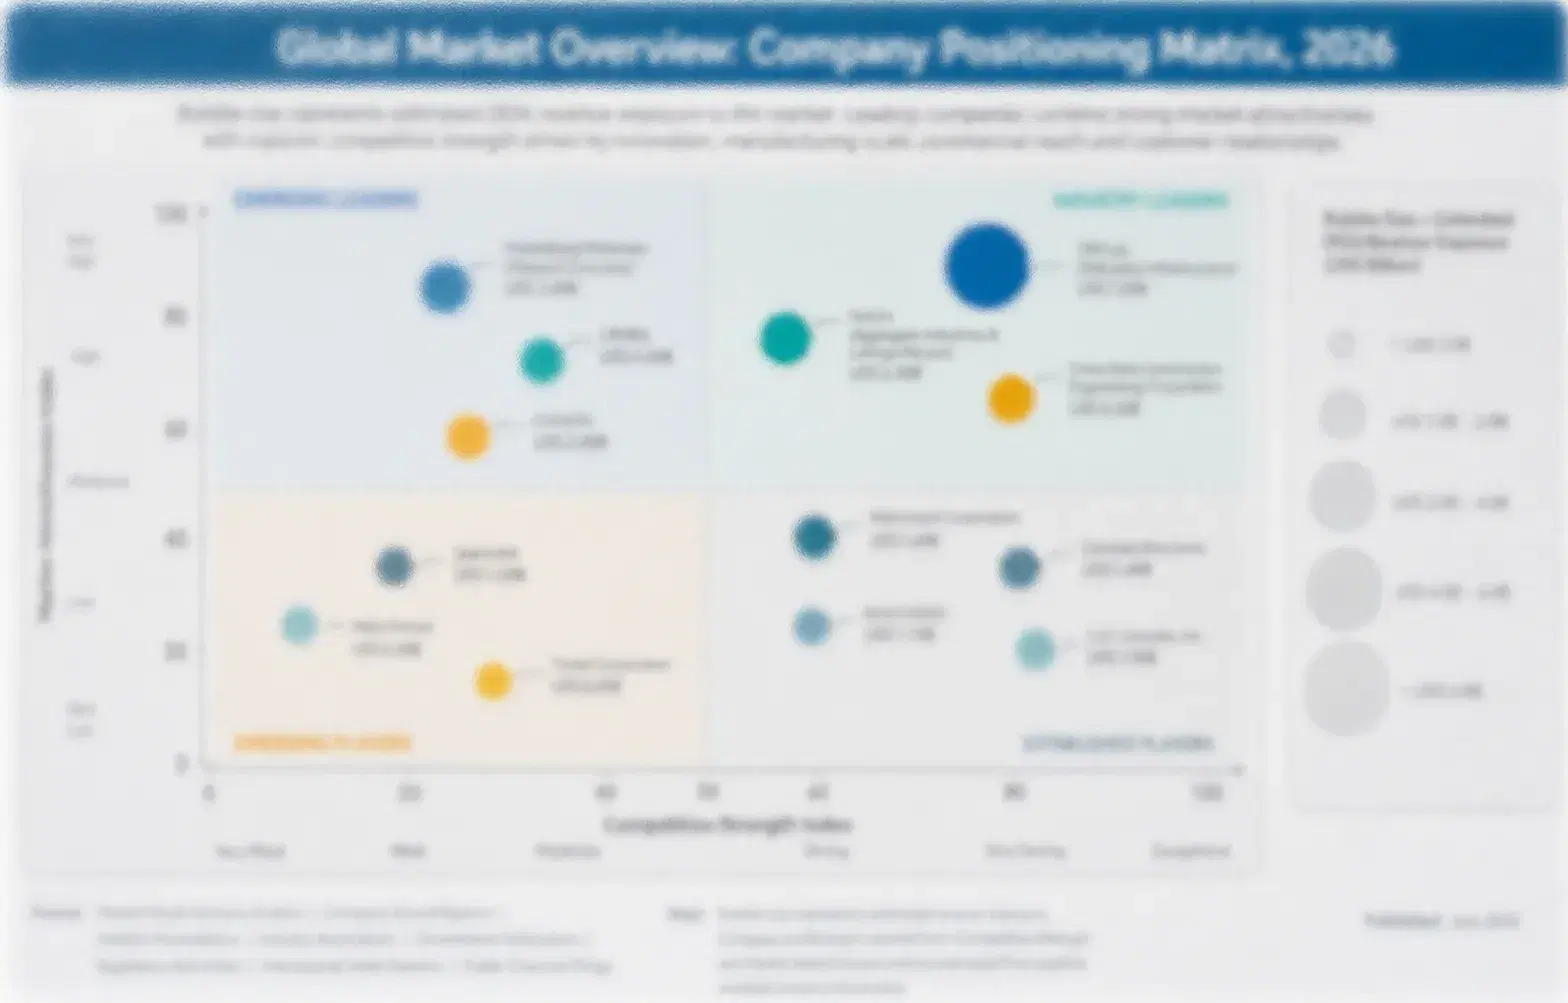
Concentration reaches 47% across the top five measured on prosthetic device revenue, and the striking thing is how little the digital entrants have actually changed it. Ottobock and Ă–ssur lead through clinical networks, componentry, and reimbursement relationships built over decades, and both have absorbed additive fabrication into their existing product lines. Blatchford, Fillauer, and Proteor follow behind them. Printing specialists have won attention rather than share.
Competition currently turns on scanning and design software rather than on any printing hardware, on whether a device fits into an existing clinic workflow without disrupting it, and on reimbursement coding relationships. Cost matters enormously in the direct-pay markets and hardly at all where insurance pays for everything, which splits this market into two separate contests that barely touch each other.

Pressure is coming from software companies who have worked out that the design layer is where the value actually sits, and from direct-pay specialists building for price points that established manufacturers cannot reach without cannibalising themselves. Rankings will shift wherever reimbursement coding changes, because that single mechanism can revalue an entire national market faster than any product ever will.
3d-printed-prosthetics-market-company-positioning-matrix-1786463177264

Competitive Moat and Risk Dimensions

OTTOBOCK

Moat: Clinical network and reimbursement position

Ottobock combines componentry manufacturing with a clinical network and decades of reimbursement relationships across the major paying health systems. A prosthesis reaches a patient through a fitting clinic and a payment code, and a company holding positions in both is extremely difficult to displace whatever a competitor's device costs or how quickly it can be printed.
OTTOBOCK

Risk: Direct-pay markets need different economics

The business is built around reimbursed provision at prices that direct-pay markets cannot reach, and discounting a device designed for German requirements does not fix a cost structure set by them. Building genuinely low-cost devices risks undermining reimbursed pricing, which is a conflict that has kept established manufacturers largely out of the fastest-growing patient populations.
OSSUR

Moat: Componentry engineering and clinical evidence

Ă–ssur holds strong positions in prosthetic feet, knees, and liners backed by clinical outcome evidence that clinicians and payers both rely on when justifying a fitting. That evidence base takes years and considerable expense to build, and it is what allows premium componentry to survive payer scrutiny in systems that increasingly demand justification for every device.
OSSUR

Risk: Socket layer sits with clinics

Ă–ssur's strength is componentry while the socket, which is where printing changes most and where devices succeed or fail, is fabricated by clinics rather than by the manufacturer. As design software and printed sockets become the deciding part of provision, value migrates toward whoever controls that layer and away from component supply.

Players Tracked

Prominent Players

Ottobock
Ossur
Blatchford
Fillauer
Proteor

Other Key Players

Open Bionics
Psyonic
Mecuris
Instalimb
Protosthetics
Unyq
Materialise
3D Systems
Stratasys
HP
Steeper Group
Ability Matters
Vispala
Koalaa
WillowWood

Recent Developments

JANUARY 2025

Programme scaled remote socket design across underserved regions

A prosthetics organisation scaled a remote design model across several underserved regions, with local technicians capturing limb scans and certified prosthetists designing sockets from elsewhere before printing near the patient. The approach let scarce clinical expertise cover a substantially larger caseload than resident fitting ever allowed.
Signal: Separating scanning from design breaks a c
JULY 2024

Manufacturer integrated additive socket fabrication into clinical workflow

An established prosthetics manufacturer integrated additive socket fabrication into its own clinical network, replacing plaster casting and hand lamination with scanning and printing right across a group of fitting centres. Clinical judgement and the number of trial fittings required stayed entirely unchanged by the switch.
Signal: Printing changes the fabrication rather th
NOVEMBER 2024

Payer questioned fabrication charges on digitally produced sockets

A health payer questioned the fabrication charges billed against codes written around conventional lamination, in cases where sockets had obviously been produced digitally in a fraction of the time. Clinics found themselves defending charges for labour the coding assumed but the method no longer actually required.
Signal: Reimbursement written around an obsolete m

Polymers, Scanning, And Clinical Time

Printing polymers carry roughly 18% to 26% of cost of goods, principally polyamide powders, photopolymer resins, and continuous fibre reinforced filaments qualified for skin contact. Certified componentry bought in, meaning feet, knees, pylons, and liners, adds 26% to 34% and comes from a small group of specialist manufacturers. Clinical and technical labour makes up most of the remainder and is the input that never gets cheaper.
Polyamide powder pricing stayed elevated through 2022 and 2023 as additive manufacturing demand grew against limited qualified capacity, and medical-grade certification narrows the supplier field considerably further. European Commission energy statistics record industrial electricity roughly doubling at the 2022 peak, which matters for powder bed fusion running continuously. Materialise and Stratasys both noted material and energy cost pressure across that period, and clinics on fixed reimbursement absorbed it.

Exposure divides by whether a supplier controls its own componentry. Manufacturers making their own feet and knees carry material cost in their own base and price the finished device. Clinics and printing specialists buying certified components in pay whatever those manufacturers charge. Direct-pay operations sit differently again, since their whole model depends on componentry cost that reimbursed suppliers have no reason to reduce.
3d-printed-prosthetics-market-cost-volatility-analysis-1786463177440

Qualify multiple medical-grade polymer suppliers

Skin-contact certification narrows the qualified powder and resin field sharply, and a single supplier disruption stops production entirely. Qualifying alternatives requires biocompatibility testing and process validation on each, which has to be finished before it is needed. Most operations run one qualified material because the second qualification never reaches the top of anybody's list.

Design around widely available componentry standards

Pylon, adapter, and attachment interfaces follow recognised standards, and designing to them rather than to a proprietary system keeps several component suppliers competing for the same slot. It costs some integration elegance and preserves genuine negotiating room on the largest bought-in cost line. Suppliers designing proprietary interfaces gain lock-in and lose that flexibility permanently.

Move technical labour to the least expensive competent level

Clinical judgement needs a prosthetist, and scanning, printing, finishing, and assembly do not. Separating those tasks properly and staffing each at the appropriate level lowers delivered cost without touching quality. It also expands what a single certified clinician can oversee, which is the same lever that addresses the workforce shortage everywhere else in this business.

Portfolio Architecture for Margin Defence

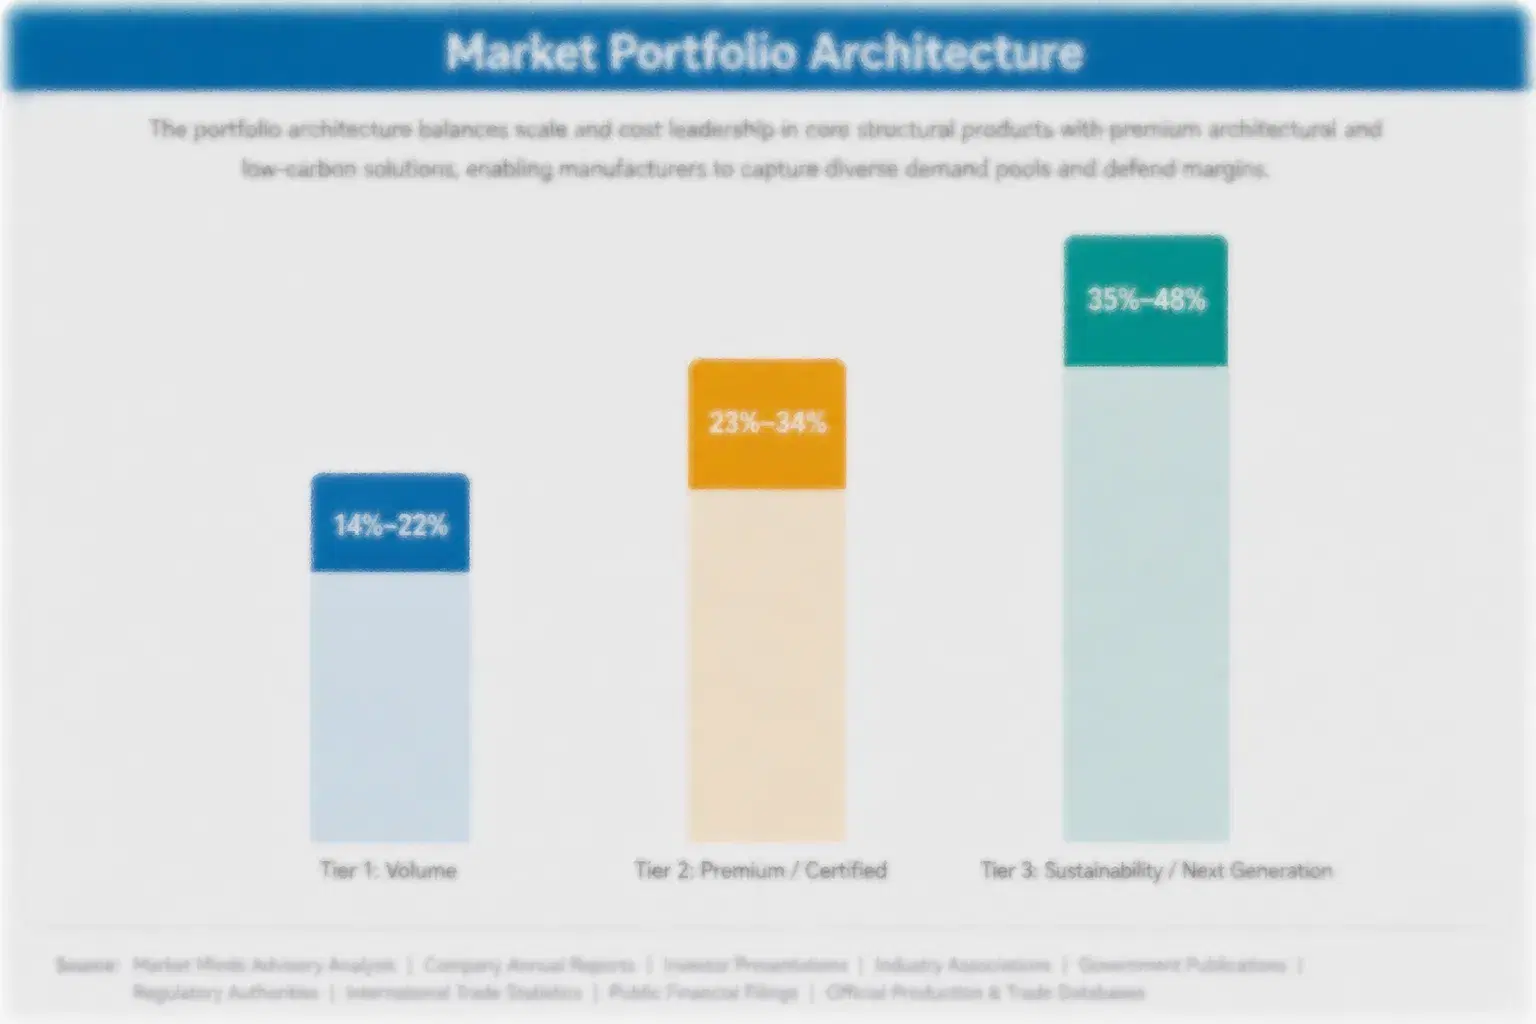
Margin here tracks who pays and under what code. A socket fabricated inside a reimbursed clinic earns whatever the payment system allows, and printing improves the clinic's cost position rather than its revenue. A device sold directly to a family earns a thin margin on a low price against a very large addressable population. Software sold to clinicians earns software margins on either side of that divide.
The volume tension is between the two halves of this market. Reimbursed provision carries most of the value on a small fraction of the world's patients, funds clinical evidence generation, and grows slowly because coverage is already near complete. Direct-pay provision carries most of the patients, grows fastest, and generates a fraction of the revenue per device. Very few suppliers serve both convincingly.

High-value pools sit in three places. Design software that lets one prosthetist oversee several times the caseload, certified componentry where clinical evidence and recognised standards sustain pricing, and reimbursement-coded digital fabrication once the coding finally catches up with the method. The first of those addresses the workforce constraint, which is the only thing genuinely limiting this market at all.

Volume / Commodity-Adjacent Tier

Direct-pay printed sockets and basic devices for markets where families purchase without any reimbursement. Volumes are large and margins thin, and the range reflects how differently purpose-built and discounted premium designs carry the price point.
Gross Margin: 16-26%

Premium / Certified Tier

Reimbursed sockets, certified structural componentry, and clinically evidenced upper limb devices. Clinical outcome evidence and reimbursement coding relationships rather than manufacturing cost are what sustain the margin in these systems.
Gross Margin: 34-46%

Sustainability / Regulatory / Next-Generation Tier

Socket design software, remote fitting platforms, and paediatric replacement programmes. The wide range reflects genuinely different economics between subscription software and physical devices for children who outgrow them every single year.
Gross Margin: 48-68%
3d-printed-prosthetics-market-portfolio-architecture-1786463177618

High-value Sub-segments and Strategic Watch-out

Socket Design Software Platforms

The only lever that touches the workforce shortage, letting one prosthetist oversee roughly four times the caseload through encoded rectification and fitting rules. Sold by subscription it earns software margins and locks a service redesigned around it. No hardware advance addresses the shortage this way.
Gross Margin: 56-72%

Certified Structural Componentry

Feet, knees, and pylons where clinical outcome evidence and recognised standards sustain premium pricing under payer scrutiny. Printing has changed the socket around these components without displacing the components themselves in any meaningful way. Printing changed the socket around them, not the components. Evidence is what defends the price.
Gross Margin: 38-50%

Direct-Pay Printed Devices

The largest patient population and the thinnest margin per device anywhere in this market by some considerable distance. It requires designing upward from a price point rather than discounting downward from a premium one, which the established manufacturers have consistently found very difficult to do.
Gross Margin: 16-26%

Paediatric Replacement Programmes

Children outgrow devices annually, which turns one fitting into a decade of repeat business that conventional fabrication priced out of reach. The watch-out is that funding for paediatric provision is charitable in most markets and therefore unpredictable. Charitable funding makes the volumes hard to forecast.
Gross Margin: 44-58%

What Follows The First Fitting

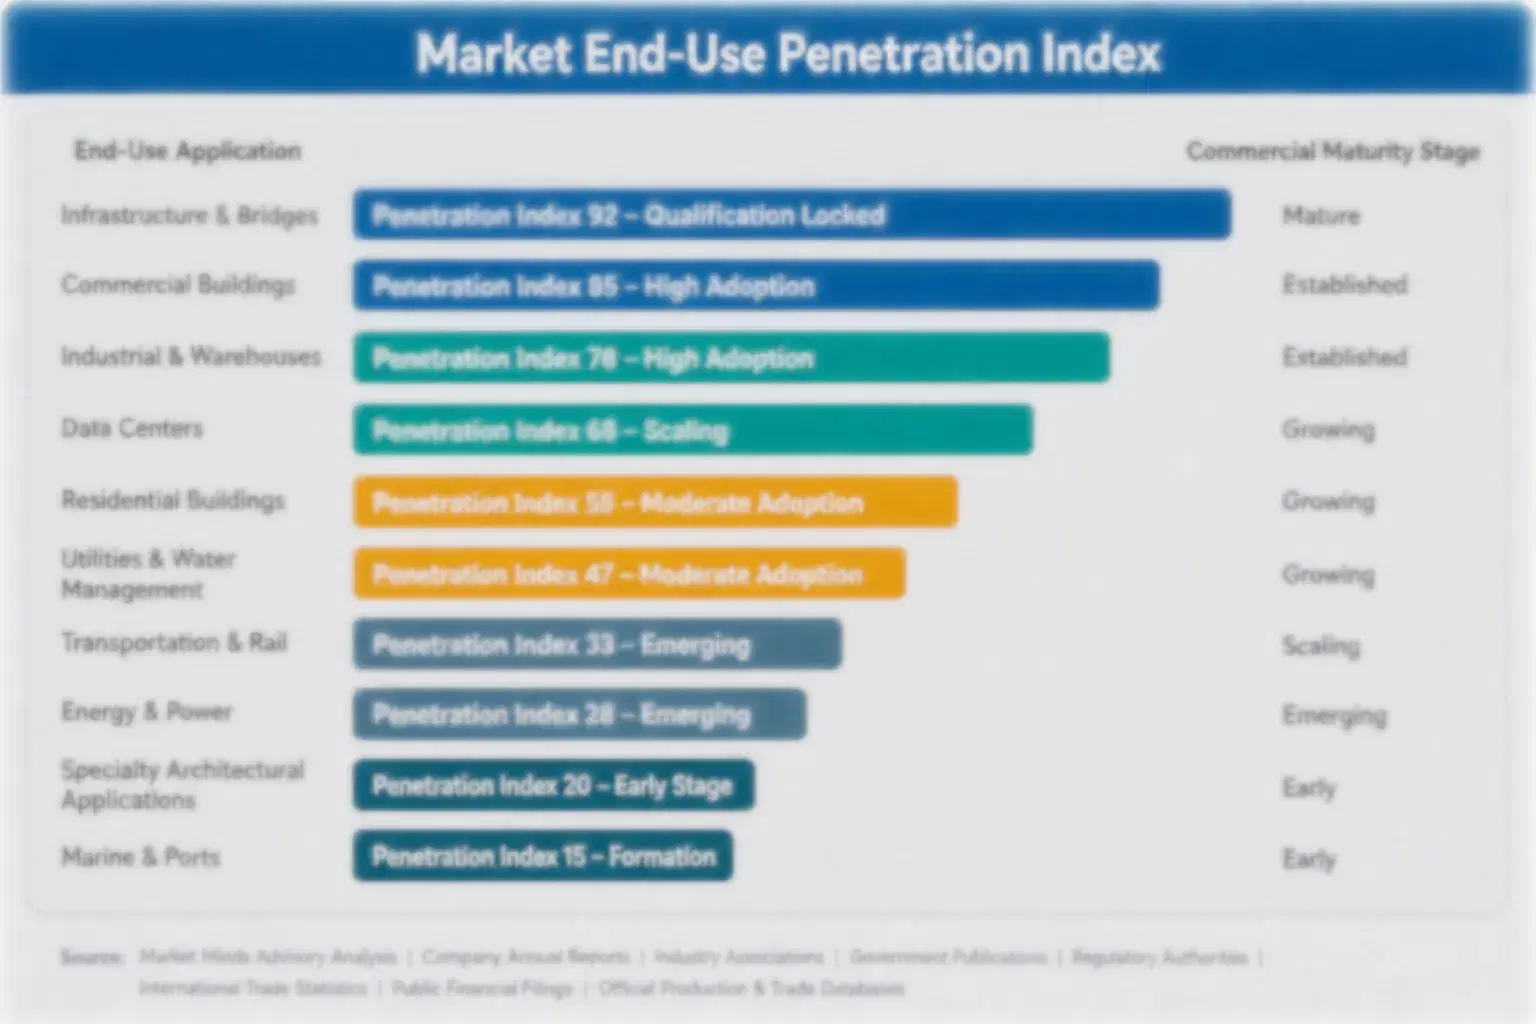
Prosthetic care is an annuity for anybody organised to collect it. A residual limb changes volume and shape for a year or more after amputation and continues changing afterwards, so sockets get replaced every one to three years across a patient's remaining life. Liners and consumables recur constantly. Paediatric patients replace annually. Printing makes each of those replacements cheap enough that they actually happen rather than being deferred.
Stickiness sits with the clinic rather than with the manufacturer. A patient returns to the prosthetist who fitted them, and the clinic decides which componentry and which fabrication method to use, which is why manufacturers with clinical networks hold positions that better products alone do not shift. Software changes this, because a clinic that redesigns its service around one design platform faces real switching cost for the first time.

Buyer profiles differ completely between the two halves of this market. In reimbursed systems the decision involves a prosthetist, a payer, and a coding framework, and the patient rarely sees a price. In direct-pay markets the family decides and the price is the whole conversation. Suppliers built for one of those consistently misjudge the other, which is why so few serve both.
3d-printed-prosthetics-market-end-use-penetration-index-1786463177789

Where To Compete Here

These are among the four positions where our research anticipates prominent divergence between winners and laggards over the coming forecast period. Each is grounded in the demand model, the regulatory perimeter, and the announced capacity pipeline.
01 / DESIGN SOFTWARE OWNERSHIP

The constraint is prosthetists, not printers

Roughly nine in ten people who need prosthetic care never receive it, and the shortage is of certified clinicians rather than of devices or of machines to make them. Software encoding rectification rules, volume accommodation, and pressure tolerance lets one prosthetist oversee around four times the caseload, which is the only lever anybody has found that touches that ratio at all. Sold by subscription it earns proper software margins and locks in a service that has been fully redesigned around it.
02 / DIRECT-PAY PRODUCT DESIGN

Design upward from the price, not downward

A device engineered for German reimbursement and then discounted for India satisfies nobody at all, because its whole cost structure was set by requirements that market does not share and cannot possibly pay for. Designing from an affordable price point upward instead reaches populations that were never going to become customers on any other basis at all. Volumes are very large and the per-device margins thin, which suits a supplier organised for exactly that and quietly destroys one that is not.
03 / REIMBURSEMENT CODE DEVELOPMENT

Get the payer to recognise the method

Payment codes written around plaster casting and hand lamination create a genuine incentive for clinics to keep working slowly, and those that print are already defending charges against assumptions that no longer hold. Establishing codes that properly recognise digital fabrication removes all of that awkwardness and legitimises adoption right across an entire national system at once. It takes evidence submissions and years of patient engagement, and whoever leads that work ends up shaping definitions worth more than any product advantage.
04 / REPLACEMENT CYCLE CAPTURE

Fit once, refit for a lifetime

A residual limb changes shape for years after an amputation and keeps on changing afterwards, so sockets get replaced every one to three years and paediatric devices annually across a whole childhood. Conventional fabrication cost meant that a great many of those replacements were quietly deferred rather than ever actually made. Printing brings all of them back within reach, which converts a single first fitting into decades of repeat work for whichever clinic and supplier stay attached to that patient.

Engagement Snapshot From the Field

A live engagement with an industry participant carrying material or product regulatory and market exposure ahead of a defining policy shift, showing how our research translates into a defensible multi-year portfolio strategy.
MARKET MINDS ADVISORY · CLIENT ENGAGEMENT SUMMARY
3D Printed Prosthetics Producer Strategic Portfolio Review and Transition Roadmap 2026·Investment Scenario on 3D Printed Prosthetics Exposure Evaluation 2025-26
CLIENT PROFILE
A non-governmental prosthetics service organisation operating fitting centres spread across four countries in South Asia and East Africa, with annual programme funding near USD 38 million (client-reported, unverified by MMA). Waiting lists at every centre exceeded a full year, and the organisation employed eleven certified prosthetists against a catchment population containing several hundred thousand amputees.
STRATEGIC CHALLENGE
Additional funding had been secured and the board assumed it should simply open more fitting centres. Management suspected the real constraint was clinicians rather than facilities, since existing centres were not operating at capacity for want of prosthetists rather than for want of space, equipment, or patients arriving at the door.
MMA APPROACH
MMA measured how each prosthetist actually spent clinical time across scanning, design, fabrication supervision, fitting, and follow-up. Tasks were then classified by whether they genuinely required certification. Remote design and printing configurations were modelled against the resulting time distribution, and a pilot ran at two centres to test the throughput assumptions in practice.
KEY FINDINGS
  1. Certified prosthetists spent roughly 55% of clinical time on tasks that did not require certification, principally scanning, fabrication supervision, and administration (client-reported, unverified by MMA).
  2. Opening additional fitting centres without additional prosthetists would have extended waiting lists rather than reducing them at any of the existing sites.
  3. Remote design let one prosthetist support scanning technicians at three separate centres, lifting fittings completed per clinician substantially above the existing baseline.
  4. Printed socket cost fell far enough that replacement fitting became affordable within programme funding, where previously most patients received one device only.
CLIENT PROFILE
A non-governmental prosthetics service organisation operating fitting centres spread across four countries in South Asia and East Africa, with annual programme funding near USD 38 million (client-reported, unverified by MMA). Waiting lists at every centre exceeded a full year, and the organisation employed eleven certified prosthetists against a catchment population containing several hundred thousand amputees.
STRATEGIC CHALLENGE
Additional funding had been secured and the board assumed it should simply open more fitting centres. Management suspected the real constraint was clinicians rather than facilities, since existing centres were not operating at capacity for want of prosthetists rather than for want of space, equipment, or patients arriving at the door.
MMA APPROACH
MMA measured how each prosthetist actually spent clinical time across scanning, design, fabrication supervision, fitting, and follow-up. Tasks were then classified by whether they genuinely required certification. Remote design and printing configurations were modelled against the resulting time distribution, and a pilot ran at two centres to test the throughput assumptions in practice.
KEY FINDINGS
  1. Certified prosthetists spent roughly 55% of clinical time on tasks that did not require certification, principally scanning, fabrication supervision, and administration (client-reported, unverified by MMA).
  2. Opening additional fitting centres without additional prosthetists would have extended waiting lists rather than reducing them at any of the existing sites.
  3. Remote design let one prosthetist support scanning technicians at three separate centres, lifting fittings completed per clinician substantially above the existing baseline.
  4. Printed socket cost fell far enough that replacement fitting became affordable within programme funding, where previously most patients received one device only.
RECOMMENDED STRATEGY
Phase 1: Phase one: redeploy prosthetist time away from scanning and fabrication supervision by training technicians at every one of the existing centres first. Phase 2: Phase two: establish remote design capability so each certified clinician can support several centres rather than being resident at only one. Phase 3: Phase three: redirect the expansion funding toward clinician training scholarships rather than into new fitting centres that cannot be staffed.
OUTCOME
The organisation cancelled two planned centres and redirected the funding into technician training and remote design capability, reporting fittings completed rising roughly 2.4 times across the following year with the same eleven prosthetists (client-reported, unverified by MMA). Replacement fittings became routine for the first time, and waiting lists at three of the four countries fell below six months.

Frequently Asked Questions

Foundational context covering the market sizes, CAGR, scope, country, region and competition that inform every finding below. This section is provided to cover basics and most often pre-purchase conversations, answered from the MMA Primary Research Dataset.

What is the current size of the 3D Printed Prosthetics Market?

The market reached USD 1.1 billion in 2025 and is forecast at USD 1.24 billion for 2026. Value concentrates in reimbursed markets while patient numbers concentrate everywhere else.

How large will the 3D Printed Prosthetics Market be by 2036?

MMA forecasts USD 3.98 billion by 2036, an increase of USD 2.74 billion over 2026. That represents an expansion multiple of 3.22 times across the forecast period.

What is the CAGR for the 3D Printed Prosthetics Market 2026 to 2036?

The base case CAGR is 12.4%, with a bull case at 13.7% and a bear case at 11.1%. The bull case depends on reimbursement coding recognising digital fabrication explicitly.

Which segment is growing fastest?

Custom sockets and interfaces grow fastest at 18.6%, exactly 1.50 times the market rate. The socket decides whether a prosthesis is worn or abandoned, and printing saves the most time there.

Who are the major companies in the 3D Printed Prosthetics Market?

Ottobock, Ă–ssur, Blatchford, Fillauer, and Proteor lead the market. The top five hold roughly 47% of revenue, and established manufacturers have absorbed additive fabrication rather than being displaced by digital entrants.

Which country is growing fastest?

India grows fastest at 16.8%, driven by an amputee population in the millions against a prosthetist workforce numbering in the hundreds. Remote design and printing are the only approach that addresses that ratio.

Report Segmentation Architecture

The full report scope spans multiple orthogonal segmentation dimensions, with cross-tabulated demand data provided for each dimension pair. Coverage extends further to regional breakdowns, trend trajectories, and the competitive detail needed to support segment-level decision-making.

By Prosthetic Component

  • Custom Sockets and Interfaces
  • Upper Limb Devices and Terminal Devices
  • Lower Limb Structural Components
  • Facial and Cranial Prosthetics
  • Covers, Fairings and Cosmesis

By End-Use Industry

  • Reimbursed Clinical Provision
  • Direct-Pay Private Provision
  • Humanitarian and Non-Governmental Programmes
  • Military and Veterans Services
  • Paediatric Rehabilitation Services

By Commercial Dimension

  • Clinic Fabrication Supply
  • Central Manufacturing Service
  • Design Software Subscription
  • Certified Componentry Supply
  • Charitable and Donated Provision

By Region

  • North America
  • South Asia and Pacific
  • Western Europe
  • East Asia
  • Latin America
  • Middle East and Africa
  • Eastern Europe

Scope, Methodology, and Coverage

Every figure in this report is reproducible from documented input assumptions. The scope below maps the historical period, the forecast horizon, the segmentation dimensions, and the countries covered, alongside the underlying primary and qualitative methodology.
Historical Period
2020 to 2025
Forecast Period
2026 to 2036
Base Year
2025 (USD billions; MMA Primary Research Dataset, August 2026)
Market Definition
The 3D printed prosthetics market comprises externally worn prosthetic devices and their components produced by additive manufacturing, valued at supplier and clinic selling prices to health systems, private payers, patients, humanitarian programmes, and military services. It spans custom sockets and interfaces, upper limb and terminal devices, lower limb structural components, facial and cranial prosthetics, and covers and cosmesis, together with the scanning and socket design software, remote fitting platforms, and certified componentry supplied alongside them. Dental prosthetics, crowns, and bridges, orthopaedic implants including joint replacements and cranial plates, orthoses, braces, and supportive devices, conventionally fabricated prosthetics, mobility aids and wheelchairs, and additive manufacturing equipment and materials sold as general industrial products are excluded.
Quantitative Units
USD billions (current prices); volume in devices and sockets delivered
Segmentation Dimensions
By Prosthetic Component; By End-Use Industry; By Commercial Dimension; By Region
Regions Covered
North America, South Asia and Pacific, Western Europe, East Asia, Latin America, Middle East and Africa, Eastern Europe
Countries Covered
USA, Canada, Mexico, Brazil, Colombia, Peru, Argentina, India, Indonesia, Philippines, Vietnam, Bangladesh, Pakistan, Australia, China, Japan, South Korea, Taiwan, Germany, UK, France, Netherlands, Sweden, Denmark, Italy, Spain, Iceland, Poland, Czechia, Romania, Ukraine, Turkey, Saudi Arabia, United Arab Emirates, Kenya, Ethiopia, Nigeria, South Africa, and additional markets relevant to this sector
Key Companies Profiled
Ottobock, Ossur, Blatchford, Fillauer, Proteor, Open Bionics, Psyonic, Mecuris, Instalimb, Protosthetics, Unyq, Materialise, 3D Systems, Stratasys, HP, Steeper Group, Ability Matters, Vispala, Koalaa, WillowWood
Quantitative Methodology
Primary survey, n=3,800 respondents, Q4 2025, six countries; demand-side model with trade association cross-validation
Qualitative Methodology
47 expert interviews, Q4 2025; applied to validate demand model assumptions, identify emerging dynamics, and assess competitive positioning
Report Format
PDF and XLSX data workbook (Word format preview document)
Publisher
Market Minds Advisory
Report Code
MMA-2026-MED-673
Published
August 2026
Contact
sales@marketmindsadvisory.com | www.marketmindsadvisory.com

Purchase the full 3D Printed Prosthetics Market Report (2026 to 2036).

The full report examines 3D printed prosthetics demand across seven regions and five components, separating reimbursed provision from direct-pay markets because the two behave nothing alike commercially. It quantifies how much certified clinician time goes on tasks not requiring certification, and models what remote design does to caseload capacity across a centre network. Competitive analysis covers twenty participants assessed on prosthetic device revenue, including why digital entrants have won attention rather than share. Regional chapters map amputee population against prosthetist workforce and reimbursement coverage separately.
Seven-region need, workforce and reimbursement analysis
Five component segmentation with growth rates
Twenty participant competitive assessment and channel positioning
Remote design caseload capacity modelling by centre
Reimbursement coding status across major paying systems
Direct-pay device cost structure against reimbursed equivalents

Built For The People Who Decide

From boardroom strategy to bench-side execution, this report is read cover-to-cover by leaders shaping the next decade of their industry, turning demand scenarios, market dynamics and valuation benchmarks into decisions.
CXOs/ Presidents/ VPs/ Managers
M&A and Corporate Development
Strategy Teams and R&D Heads
Procurement and Product Directors
Regulatory and Compliance Leaders
Investor Relations and Equity Analysts