
Market Minds Advisory
3D Imaging Surgical Solution Market

3D Imaging Surgical Solution Market: Augmented Reality and the Navigation Platform Transition

Intraoperative imaging is shifting from static two dimensional fluoroscopy toward real time three dimensional navigation, as hospitals weigh capital equipment upgrades against reimbursement pressure and a widening skills gap in advanced surgical visualization technology adoption.

Lead Analyst

Alice Ballenger

Published

August 2026

Make Smarter Decisions with Customized Research Insights

Request a free sample report and evaluate market opportunities, growth trends, and competitive dynamics relevant to your business needs.

2025 MARKET VALUE$3.8BMarket Size 2025
2036 FORECAST VALUE$10.3BBase Case , 2026 to 2036
CAGR 2026 TO 20369.5 %Bull 10.7% / Bear 8.3%
INCREMENTAL OPPORTUNITY$6.2BNet 10- year value creation
EXPANSION MULTIPLE2.48x2036 value over 2026 base
Strategic Levers
M&A Pipeline
Regional Outlook
Country Rankings
Competitive Intelligence
Segmental Deep-dive
Call-Us : 91 93563 13602

Executive Snapshot and Market Trajectory

Three dimensional intraoperative imaging has moved from a niche neurosurgery tool to a mainstream orthopedic and spine capital purchase, as hospitals increasingly treat navigation accuracy as a patient safety requirement rather than an optional upgrade competing against routine equipment budgets, particularly at high volume academic medical centers replacing imaging fleets.
Augmented reality surgical visualization and robotic-assisted imaging integration are growing at roughly 1.66x the market average as spine and orthopedic surgeons adopt navigation platforms that reduce fluoroscopy exposure and shorten operating room time. North America retains the largest revenue base on dense hospital capital budgets and favorable device reimbursement codes, while East Asia is compounding fastest as China's hospital modernization programme funds first time navigation system purchases across provincial medical centers.
Competitive intensity concentrates among five diversified surgical technology vendors that increasingly bundle imaging hardware, navigation software, and robotic integration into a single operating room platform, leaving smaller imaging specialists to compete on price for standalone C-arm hardware. Regulatory clearance pathways and surgeon training investment, not raw image resolution alone, increasingly determine which vendors win multi-hospital system contracts. Group purchasing organizations are beginning to standardize selection.
Market Definition
The 3D imaging surgical solution market covers intraoperative three dimensional imaging hardware, surgical navigation software, and augmented reality visualization systems used to guide spine, orthopedic, neurosurgical, and trauma procedures in real time. It includes mobile and fixed intraoperative CT and cone-beam imaging systems, navigation platforms, and the patient-specific guides derived from preoperative imaging data. Diagnostic-only imaging equipment used outside the operating room is excluded.
Base Year Value
$3.8B in 2025 (MMA Primary Research Dataset, August 2026)
Forecast Period
2026 to 2036, eleven discrete annual values
CAGR
9.5% base case. Bull 10.7%. Bear 8.3%.
Fastest Growth Segment
Augmented Reality Surgical Visualization Systems: 15.8% CAGR
Fastest Growth Country
China: 13.2% CAGR
Fastest Growth Region
South Asia and Pacific: 11.8% CAGR
Largest Region
North America: 30% of 2025 global value
Market Leaders
Stryker, Medtronic, Brainlab, Zimmer Biomet, GE Healthcare. Source: MMA Analysis based on company annual reports.
Primary Survey
n=3,800 procurement and R&D decision-makers, Q4 2025, six countries
Methodology
Demand-side build-up, cross-validated against public data, 47 expert interviews

3D Imaging Surgical Solution Market Forecast Scenarios

3d-imaging-surgical-solution-market-size-forecast-scenario-1787303853108
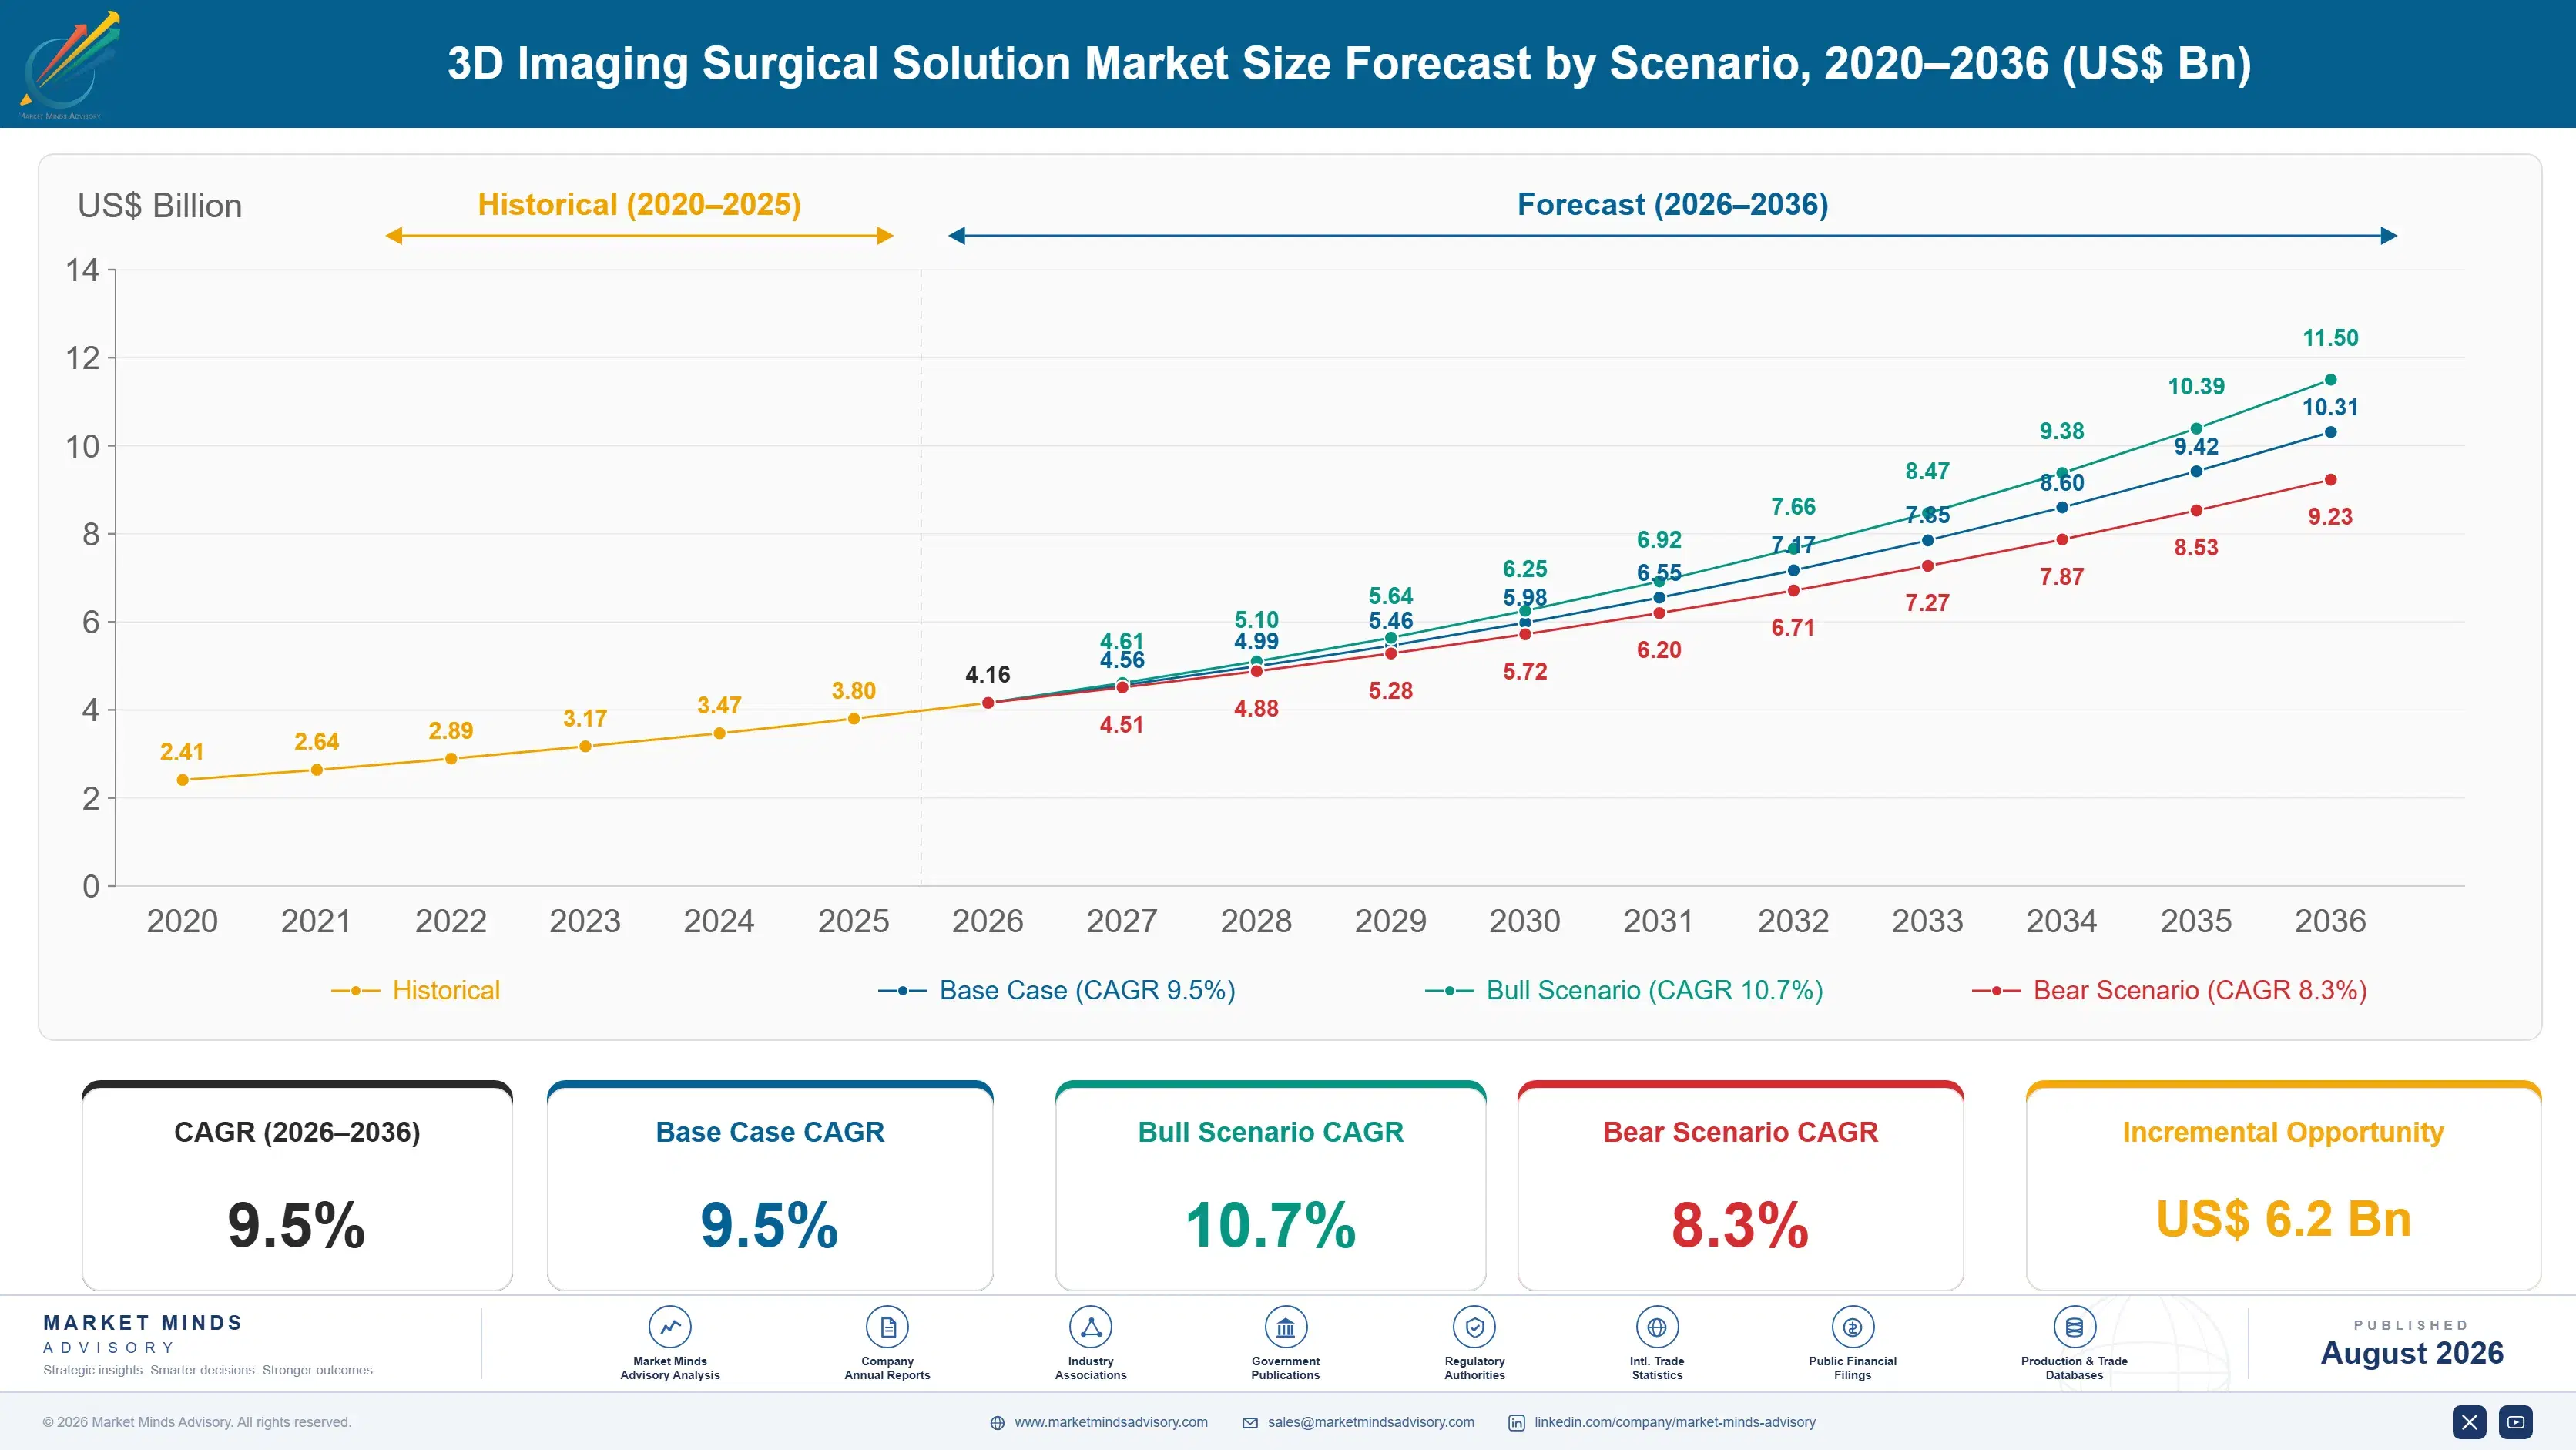
Between 2020 and 2025 the market grew at an estimated 8.5% historical CAGR, recovering from pandemic-era elective surgery deferrals before accelerating as hospitals resumed capital equipment purchasing and spine surgery volumes rebounded above pre-pandemic levels. Early augmented reality visualization pilots launched during this period built the clinical evidence base that is now driving broader adoption across orthopedic surgery centers.
The base case assumes 9.5% CAGR through 2036, anchored in three mechanisms: rising spine and orthopedic procedure volumes requiring image-guided precision to reduce revision surgery rates, hospital capital replacement cycles retiring first-generation navigation systems installed a decade ago, and expanding reimbursement coverage for navigation-assisted procedures across major payer systems. Augmented reality visualization adoption adds a reinforcing tailwind as surgeons increasingly expect heads-up display guidance rather than looking away from the patient toward a separate navigation monitor during critical procedure steps.
A bull scenario, near 10.7% CAGR, assumes faster robotic-assisted surgery adoption and accelerated reimbursement expansion pull navigation platform orders forward across more procedure types. The bear case, near 8.3%, assumes hospital capital budgets tighten amid margin pressure and providers extend the service life of existing navigation systems by two to three years rather than replacing them on schedule.

Navigation Accuracy Becomes a Reimbursement and Safety Standard

Three forces are converging on surgical imaging demand simultaneously: rising spine and orthopedic procedure volumes requiring image-guided precision, a hospital capital replacement cycle retiring navigation systems installed during the early 2010s technology wave, and expanding payer reimbursement for navigation-assisted procedures that once required separate justification. Surgeons who once viewed navigation as an optional add-on now specify it as a baseline requirement for complex spine and r
MARKET CONCENTRATION62%Combined revenue share held by top five surgical vendors
SYSTEM ASP$1.8MBlended selling price for an integrated navigation platform
REPLACEMENT CYCLE7-9 yrsTypical service life before hospitals replace navigation hardware
NAVIGATION ATTACH RATE41%Share of eligible spine procedures using image guidance
TOP DEPLOYMENT COUNTRYUnited StatesLeading country for installed navigation system volume today
FLUOROSCOPY TIME REDUCTION35%Typical intraoperative radiation exposure reduction reported by surgeons
Commercially, the category increasingly resembles a platform relationship bundled around training, software updates, and clinical support rather than a one-time capital sale. Hospitals commit to multi-year service and software agreements spanning imaging hardware, navigation software, and surgeon training, since fragmenting these functions across multiple vendors creates workflow friction that a unified platform avoids across the surgical suite and connected recovery areas.
Over the next decade, expect augmented reality visualization to keep gaining share within the broader navigation budget as clinical evidence accumulates, continued consolidation among smaller imaging vendors unable to fund navigation software development, and growing scrutiny of radiation exposure driving faster fluoroscopy-reduction technology adoption across trauma and spine centers nationwide, particularly at high volume teaching hospitals.
"Surgeons used to ask how sharp the intraoperative image looked. Now the first question is how much radiation exposure and revision risk a navigation platform can remove from the case, because that tradeoff now shapes purchasing committees, not just individual surgeon preference."
Director, Surgical Technology and Medical Devices Practice · MMA Surgical Imagin

Market Trends

Augmented Reality Visualization Enters Mainstream Spine Surgery

Surgeons are increasingly adopting heads-up augmented reality visualization that overlays navigation guidance directly onto the surgical field, replacing the older workflow of glancing away toward a separate navigation monitor during critical steps. Each new AR-enabled navigation platform launch increasingly requires vendors to demonstrate measurable reductions in procedure time and radiation exposure alongside traditional accuracy specifications, a clinical evidence bar that barely existed five years ago. Early adopting hospitals report meaningfully shorter procedure times and higher surgeon satisfaction scores, reinforcing AR visualization as the standard specification for new spine and orthopedic navigation platform purchases across major academic centers.
Market Impact: Covers 2,400 additional operating r
Robotic-Assisted Imaging Integration Expands Beyond Spine Surgery

Robotic-assisted surgical platforms are increasingly integrating directly with intraoperative 3D imaging systems, allowing real time image registration that improves implant placement accuracy without requiring a separate navigation array setup step. Orthopedic and trauma surgeons are extending robotic-imaging integration beyond its original spine surgery use case into joint replacement and complex trauma reconstruction procedures, broadening the addressable clinical base for combined platforms considerably. Hospitals investing in robotic-imaging integration report faster room turnover between cases, since the combined workflow eliminates redundant imaging and registration steps that separate systems previously required for every single procedure.
Market Impact: Adds 15% to reimbursement eligible

Market Opportunities and Growth Drivers

Rising Spine and Orthopedic Procedure Volumes Drive Adoption

Aging populations across major healthcare markets are driving rising volumes of spine fusion, joint replacement, and complex trauma procedures, each of which increasingly specifies image-guided navigation to reduce revision surgery risk and improve implant placement accuracy. Hospitals report that navigation-guided procedures show measurably lower revision rates than freehand techniques, a clinical outcome payers increasingly reward through favorable reimbursement coding for image-guided cases. This procedure volume growth is expanding the installed base of navigation-capable operating rooms well beyond the neurosurgery centers that historically drove most category demand across the broader hospital system.
Market Impact: Excludes 40% of community hospitals

Reimbursement Expansion Pulls Navigation Purchases Forward

Major payers across the United States and Western Europe are expanding reimbursement coverage for navigation-assisted spine and orthopedic procedures, removing a longstanding barrier that once required hospitals to absorb navigation costs without a corresponding revenue offset. Hospitals report that securing favorable reimbursement codes for navigation-assisted cases can shift a marginal capital equipment decision into an easily justified purchase within a single budget cycle. This reimbursement tailwind is pulling forward replacement decisions that might otherwise have waited for the next capital planning cycle, since finance committees increasingly view navigation as revenue-protective rather than purely cost-additive equipment.
Market Impact: Extends switching cycle 12-18 month

Market Restraints and Challenges

High Capital Cost Limits Adoption at Smaller Hospitals

Integrated navigation platforms carry capital costs well beyond what smaller community hospitals can justify against their surgical volume, and the root cause is that navigation hardware, software licensing, and surgeon training together represent a substantial multi-year commitment few smaller facilities can amortize quickly. The commercial impact falls hardest on rural and community hospital systems, since limited surgical volume extends the payback period for a navigation platform well beyond what capital committees typically approve. Vendors are mitigating this by offering shared-service and mobile navigation rental models that spread cost across multiple facilities within a hospital network.
Market Impact: Cuts procedure time by 18%

Surgeon Training Requirements Slow Platform Switching Decisions

Switching navigation platforms requires retraining an entire surgical team on new workflow steps, and the root cause is that navigation software interfaces differ meaningfully between vendors despite similar underlying accuracy specifications, creating a learning curve that surgeons are reluctant to absorb mid-career. The commercial impact falls hardest on challenger vendors trying to displace an incumbent platform, since surgeon preference for a familiar workflow often outweighs marginal accuracy or price advantages a newer platform might offer. Vendors are mitigating this by investing in simplified user interfaces and structured onboarding programmes that shorten the retraining period considerably.
Market Impact: Adds 1,200 new hospital installatio
3 additional market trends, 3 additional growth drivers, and 3 additional restraints and challenges are covered in the full report. Contact sales@marketmindsadvisory.com to access the complete intelligence.

Segment CAGR and Growth Architecture

Segmentation follows surgical technology type, the single dimension hospitals specify against when planning an operating room capital upgrade or navigation platform purchase. Intraoperative imaging hardware, navigation software, augmented reality visualization, robotic-imaging integration, patient-specific guides, and data management systems each serve a distinct function, keeping hardware and software dimensions separate across every procedure type, specialty, and hospital setting served today.
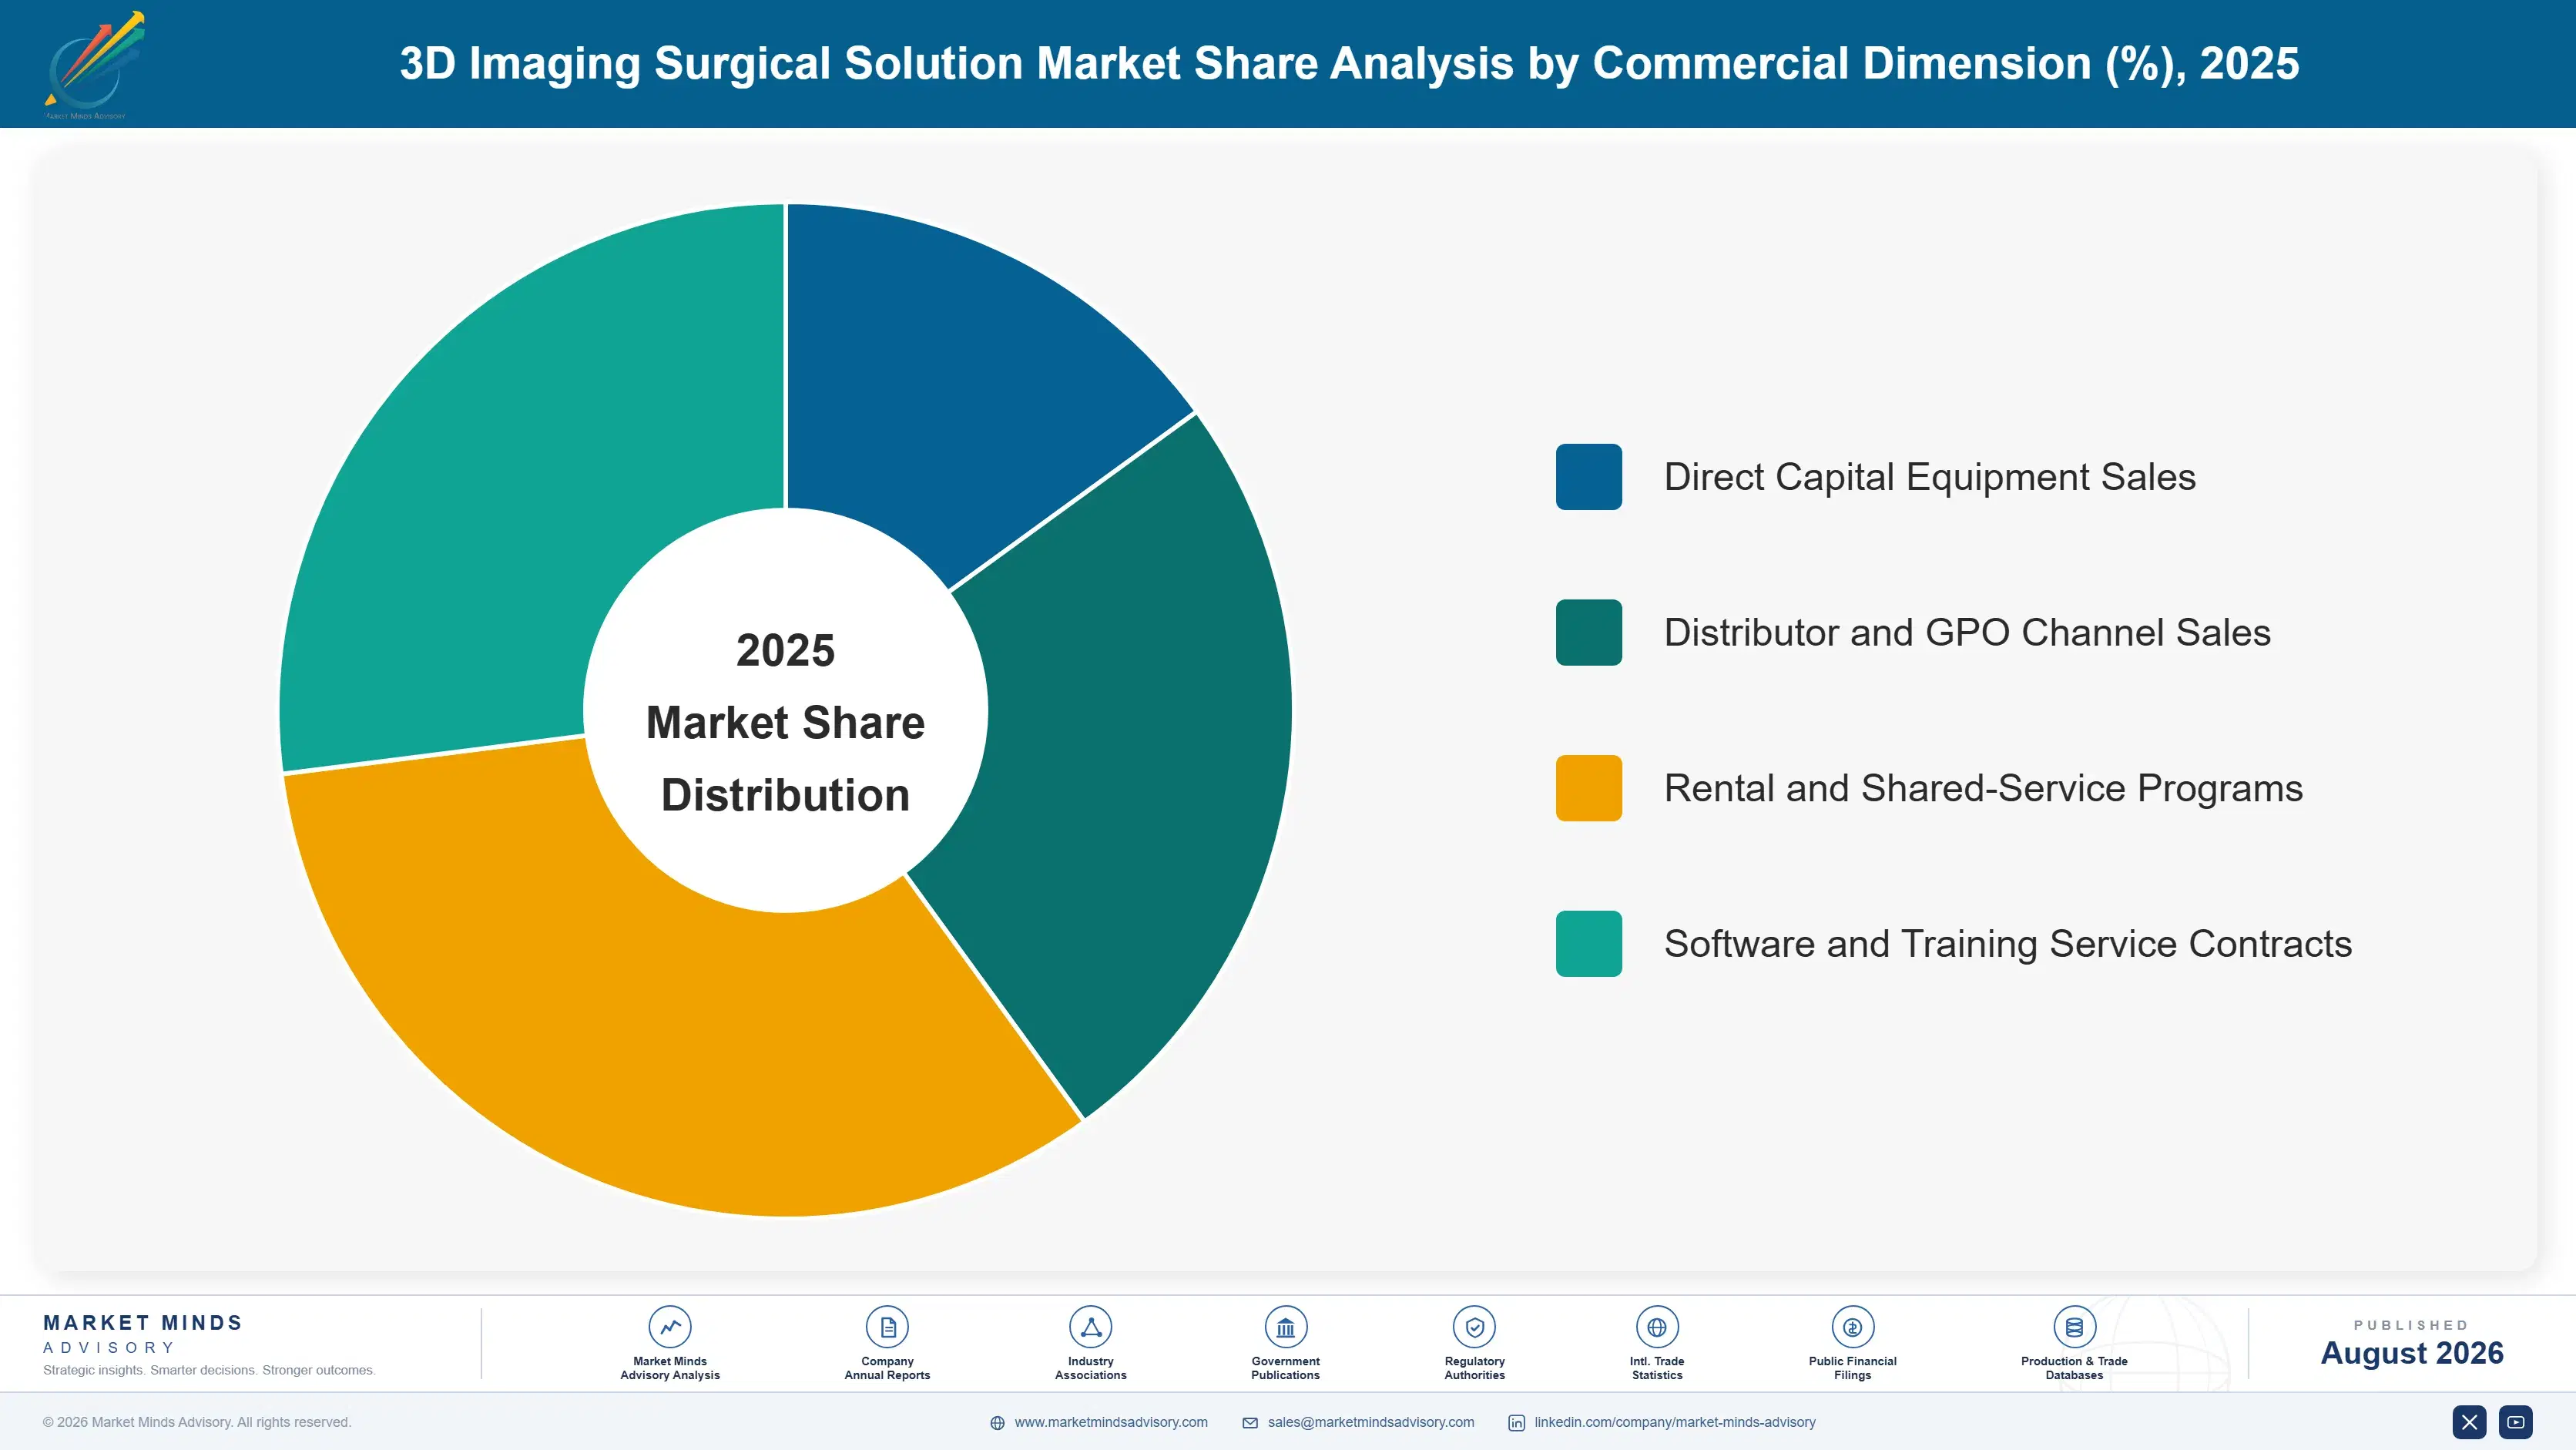
3d-imaging-surgical-solution-market-market-share-analysis-1787303853681

Augmented Reality Surgical Visualization Systems

Augmented reality visualization systems overlay real time navigation guidance directly onto the surgeon's field of view through heads-up displays or specialized eyewear, eliminating the need to glance toward a separate navigation monitor during critical procedure steps. Adoption is concentrated among high volume academic spine and orthopedic centers seeking to reduce procedure time and improve surgeon ergonomics during long complex cases. Growth outpaces the broader market by roughly 1.66x as clinical evidence accumulates and surgeons trained on AR platforms during residency enter independent practice. Vendors with proven registration accuracy and low latency tracking are capturing outsized share, since surgeons are reluctant to trade proven freehand technique for a platform that lags during rapid instrument movement.
CAGR 15.8%

Robotic-Assisted Imaging Integration Platforms

Robotic-assisted imaging integration platforms combine intraoperative 3D imaging with robotic guidance arms, allowing real time image registration that improves implant placement accuracy without a separate navigation array setup step for each procedure. Adoption is concentrated among high volume joint replacement and spine centers where robotic assistance meaningfully reduces implant placement variability across surgeon experience levels. Growth remains strong as robotic platforms extend beyond their original spine surgery use case into trauma and joint reconstruction procedures. Hospitals completing robotic-imaging integration upgrades report measurably improved implant placement accuracy and faster room turnover, reinforcing combined platforms as the standard specification for new operating room capital investment across major hospital systems currently expanding robotic surgery service lines.
CAGR 13.6%
Full segment breakdown across 6 segments available in the complete report.

Regional Architecture and Country Demand Map

North America retains the largest revenue base on dense hospital capital budgets and favorable navigation reimbursement codes, while East Asia is compounding fastest as China's hospital modernization programme funds first time navigation purchases across provincial medical centers and expanding surgical training capacity nationwide.

North America

United States academic medical centers and multi-hospital health systems anchor the region's leading revenue base, replacing first-generation navigation systems installed during the early 2010s while adding augmented reality visualization to new operating room builds. Canadian provincial health systems continue steady navigation adoption tied to centralized capital procurement programmes covering major teaching hospitals. Favorable reimbursement coding for navigation-assisted spine and orthopedic procedures across major United States payers continues supporting purchase justification even at smaller community hospitals previously priced out of the category. Growth trails East Asia because the region's navigation installed base is already comparatively mature, meaning much of current demand reflects replacement and AR upgrade rather than first-time installation across established hospital networks.
Share: 30% | CAGR: 8.8% (2026 to 2036)

Western Europe

German and French university hospitals, among Europe's most active spine and orthopedic surgical centers, sustain steady demand for both navigation hardware and augmented reality upgrades tied to national capital equipment renewal programmes. United Kingdom National Health Service trusts continue expanding navigation adoption tied to centralized procurement frameworks covering major teaching hospital trusts nationwide. Regional device vendors, including several leading European navigation software developers, maintain strong domestic penetration built on established surgeon training relationships across major academic centers. Regional growth trails the global rate as the market's already high penetration of navigation systems among academic centers limits the incremental upside further capital cycle renewal alone can provide relative to less mature markets elsewhere in the forecast.
Share: 22% | CAGR: 7.8% (2026 to 2036)
Regional intelligence for 5 additional markets available in the complete report: East Asia, South Asia and Pacific, Latin America, Middle East and Africa, Eastern Europe. Contact sales@marketmindsadvisory.com.
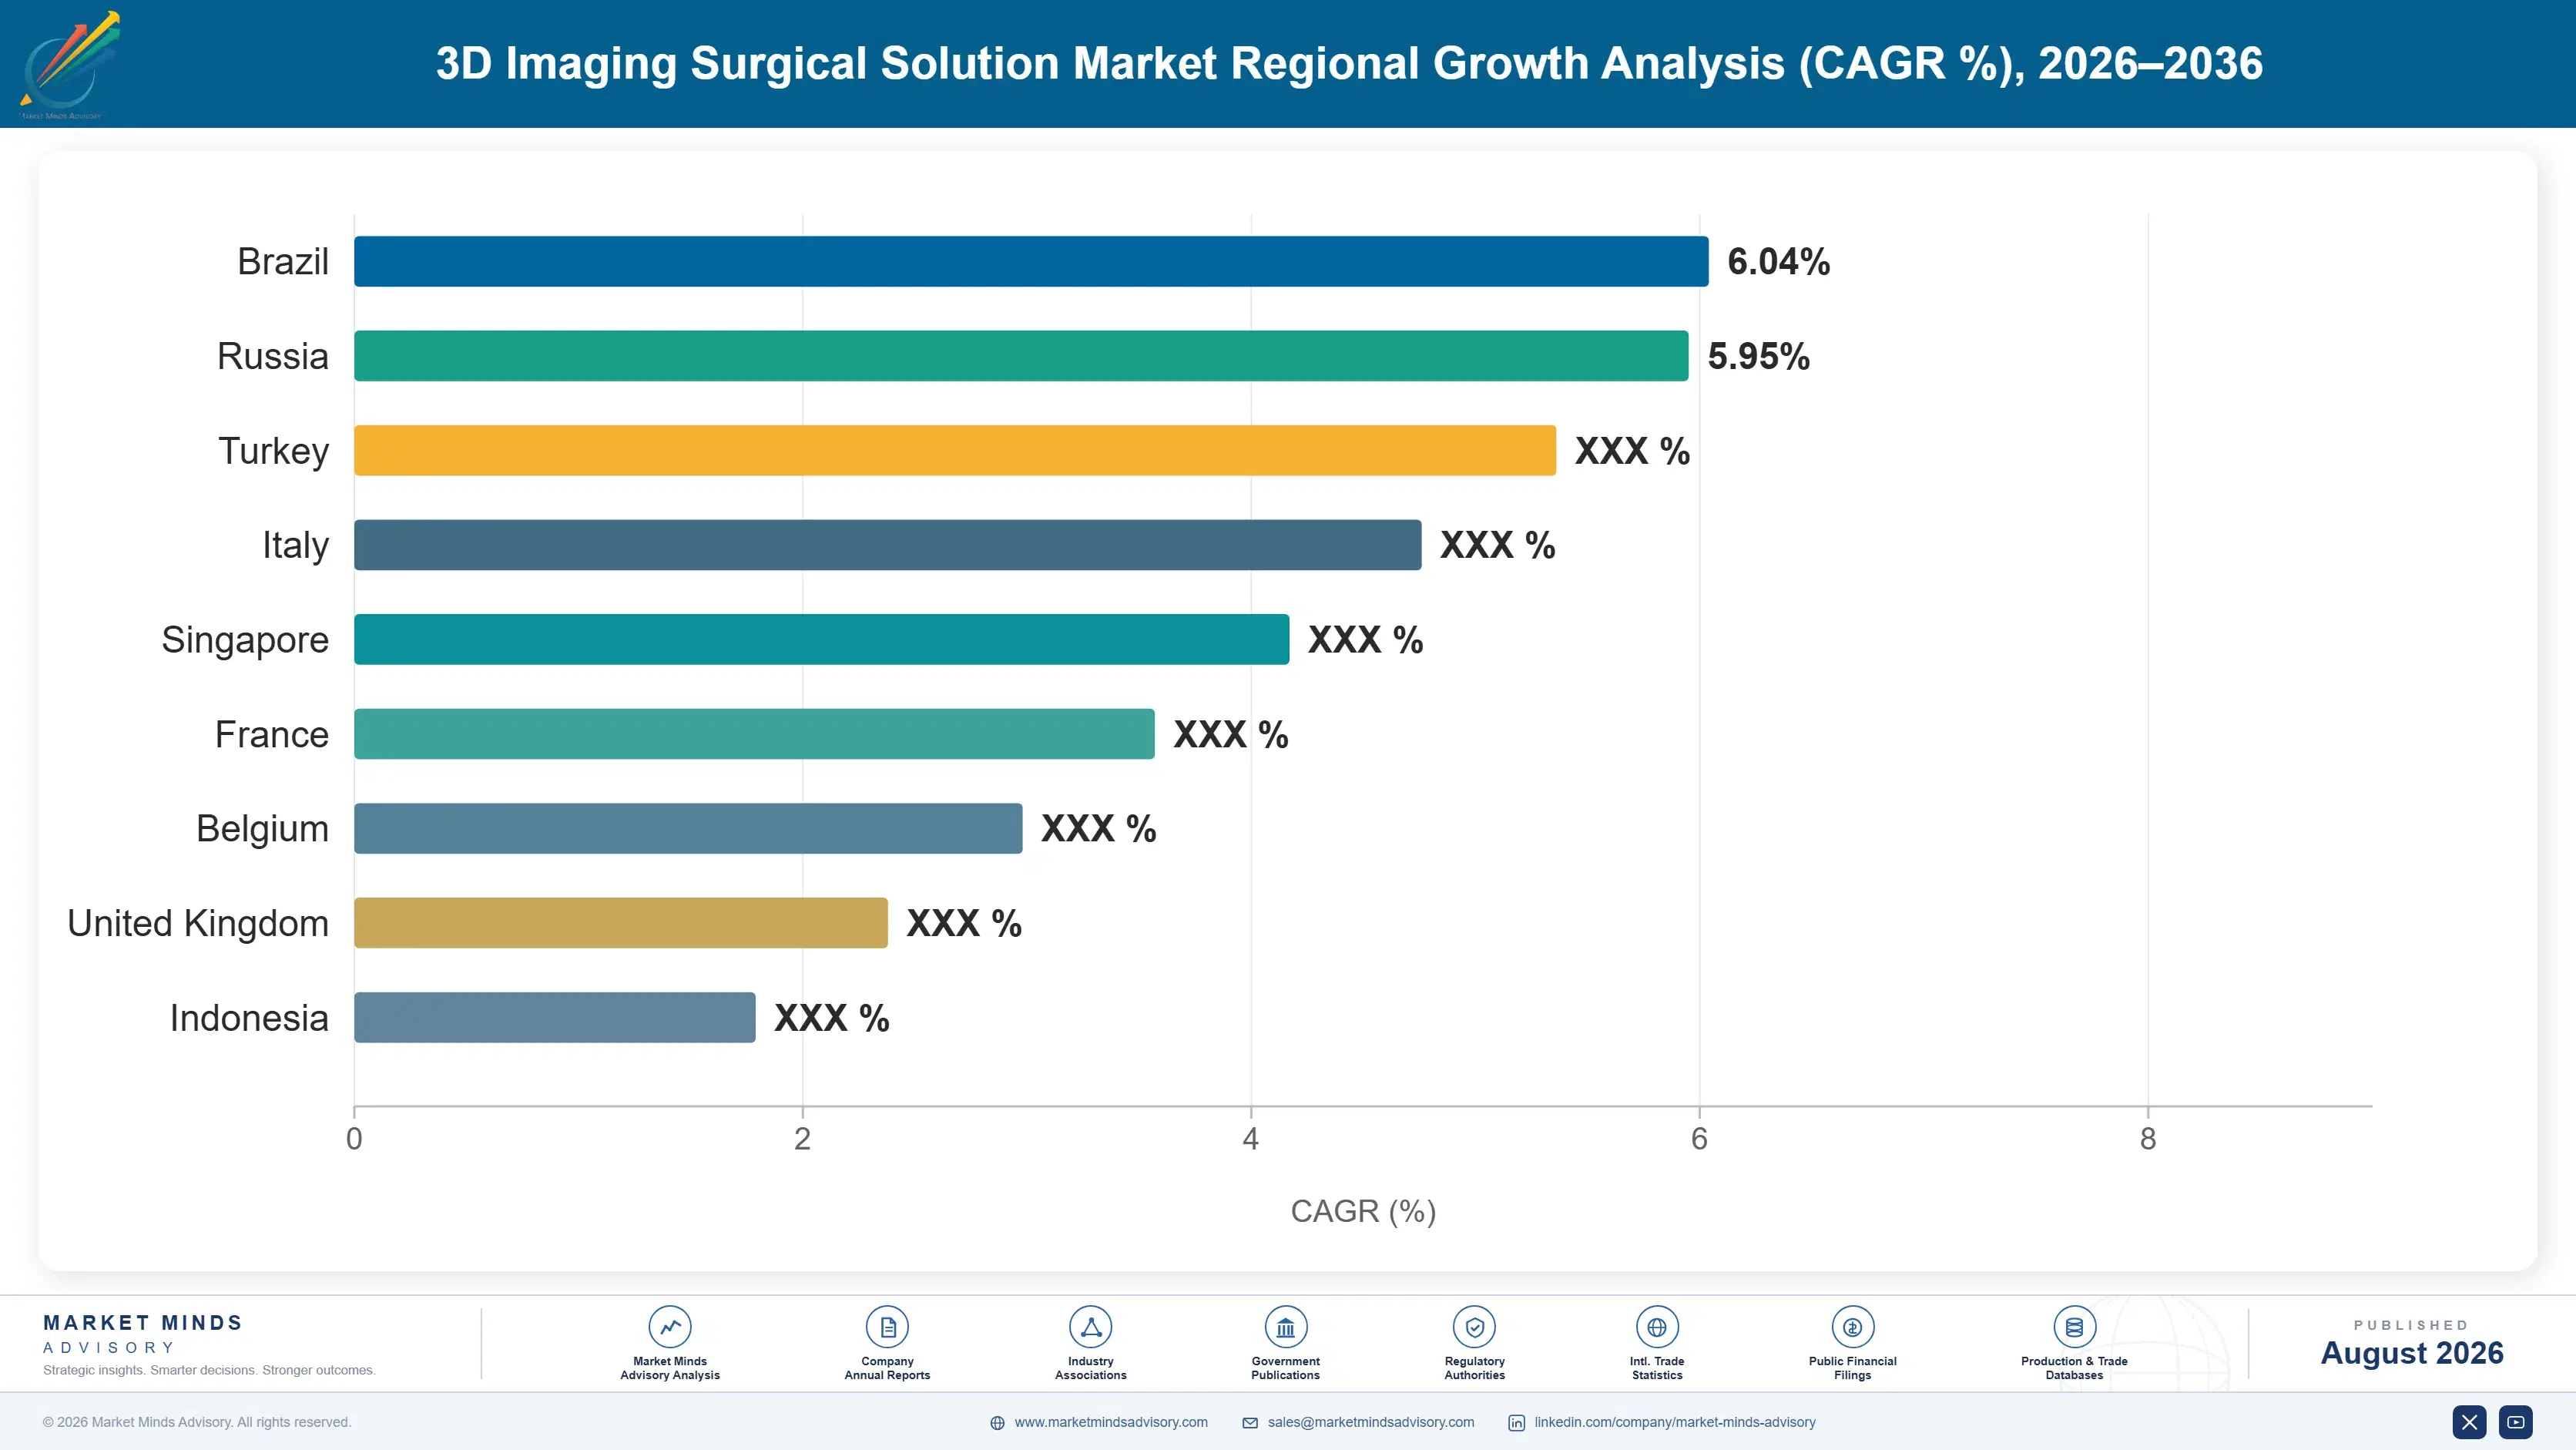
3d-imaging-surgical-solution-market-country-cagr-analysis-1787303854193

Monetizing Software Subscriptions and Surgeon Training Programs

Vendors are shifting commercial models toward navigation software subscriptions, surgeon training contracts, and multi-facility platform agreements rather than one-time hardware sales, since hospital demand for clinical support and workflow continuity now rivals raw imaging accuracy as a purchase criterion. This mirrors a broader shift across medical device categories toward relationship-based commercial structures over transactional pricing.

Selling Continuous Navigation Software Update Subscriptions

Vendors are increasingly selling continuous navigation software subscriptions that provide regular feature updates, clinical workflow refinements, and technical support across a hospital's installed navigation fleet, converting what was historically a one-time software license into recurring annual revenue tied directly to the size of a hospital's connected navigation footprint. Vendors report subscription attach rates above 48% among academic medical centers running the highest surgical volumes, with renewal rates exceeding 88% once a hospital experiences a full year of documented workflow improvement. This service layer increasingly determines vendor selection ahead of raw hardware pricing during large hospital system contract negotiations.
Market Impact: Lifts recurring revenue share to ro

Bundling Structured Surgeon Training and Certification Programs

Vendors are increasingly bundling structured surgeon training and certification programmes into multi-year platform agreements, converting a previously ad hoc onboarding process into predictable recurring revenue while reducing the risk of underutilized navigation hardware sitting idle in the operating room. Programmes typically include ongoing proctoring and case support commitments beyond the initial go-live period, a service level that meaningfully reduces the risk of surgeons reverting to freehand technique after a difficult early case. Vendors report training contract attach rates rising fastest among multi-hospital systems onboarding dozens of surgeons simultaneously, with roughly 39% of new platform contracts now including bundled certification.
Market Impact: Adds $65,000 per facility in annual

Offering Mobile and Shared Navigation Rental Programs

Vendors are increasingly offering mobile and shared navigation rental programmes that give smaller community hospitals access to navigation technology without a full capital purchase, expanding the addressable market beyond high volume academic centers that dominate outright purchases today. This rental path typically costs meaningfully less upfront than a full platform purchase while still delivering most of the clinical benefit, with rental orders now representing roughly 21% of total navigation segment revenue among smaller facilities. Vendors report rental attach rates rising fastest among rural hospital networks facing surgeon recruitment pressure without budget for a complete navigation system purchase.
Market Impact: Expands addressable hospital count

Structuring Multi-Facility Platform Standardization Agreements Jointly

Vendors are increasingly structuring multi-year platform standardization agreements that extend a single navigation and imaging platform across a hospital system's entire surgical footprint rather than negotiating each facility independently, giving health systems consistent training, technical support, and clinical protocols across all locations. Health systems report cost of ownership reductions of roughly 16% once platform standardization eliminates the redundant vendor management overhead multiple incompatible systems previously required across a growing hospital network. Vendors with proven multi-facility deployment track records spanning at least 25 hospitals are capturing outsized share of these system-wide agreements ahead of single-site competitors.
Market Impact: Cuts system-wide operating cost by

Who Controls the Margin Pool

The top five vendors hold roughly 62% combined share, a meaningfully high concentration reflecting both the regulatory clearance complexity of integrated navigation platforms and the surgeon training relationships that keep smaller imaging specialists confined to standalone hardware sales. The gap between the leading platform vendors and smaller regional challengers is widening as hospital systems increasingly restrict vendor shortlists to companies with demonstrated multi-facility deployment ex
Current competitive activity centers on three fronts: augmented reality visualization feature development, robotic-imaging integration partnerships extending navigation beyond spine surgery, and surgeon training programme expansion supporting multi-hospital system rollouts. Several regional vendors are pursuing partnerships with dedicated software developers rather than building AR capability in house, a faster but margin-diluting route to feature parity with established vendors' integrated platforms.

Emerging pressure comes from Chinese and South Korean vendors moving up the value chain from basic imaging hardware into integrated navigation platforms sold initially to domestic hospitals but increasingly targeting export markets as regulatory clearances accumulate. Rankings among the top five could shift if a leader fails to close its augmented reality capability gap, since hospital systems increasingly evaluate platform completeness ahead of individual imaging resolution specifications during large system contract decisions.
3d-imaging-surgical-solution-market-company-positioning-matrix-1787303854717

Competitive Moat and Risk Dimensions

STRYKER

Moat: Integrated platform breadth

Stryker's combination of imaging hardware, navigation software, and robotic-assisted surgery under a single platform gives it a design-in advantage with hospital systems seeking one accountable vendor relationship rather than piecemeal sourcing across multiple specialized suppliers. That platform advantage compounds with every additional connected operating room a health system adds.
STRYKER

Risk: Slower niche responsiveness

Stryker's scale and broad product portfolio can slow its response to niche specialty requests that smaller focused vendors serve more quickly, occasionally costing it accounts among surgeons prioritizing rapid custom configuration support over full-platform integration convenience. That responsiveness gap is unlikely to close without a dedicated small-account service tier.
MEDTRONIC

Moat: Deep spine surgery relationships

Medtronic's decades of accumulated spine implant and navigation integration expertise give it durable credibility among surgeons who weigh proven clinical outcomes heavily, since switching navigation platforms without comparable implant compatibility carries meaningful clinical and workflow risk. That expertise compounds with every additional certified spine procedure Medtronic supports.
MEDTRONIC

Risk: Augmented reality portfolio still developing

Medtronic's augmented reality visualization portfolio remains comparatively less mature than dedicated AR-focused specialists, occasionally requiring it to partner with third-party display providers for the most demanding academic center contracts rather than offering a fully native solution built entirely in house, ceding some margin to partners.

Players Tracked

Prominent Players

Stryker
Medtronic
Brainlab
Zimmer Biomet
GE Healthcare

Other Key Players

Siemens Healthineers
Canon Medical Systems
Philips Healthcare
KARL STORZ
Olympus Corporation
NuVasive
Globus Medical
Smith & Nephew
B. Braun Melsungen
Fujifilm Holdings
Intuitive Surgical
Carestream Health
Materialise NV
Elekta AB
Hologic Inc

Recent Developments

SEPTEMBER 2025

Stryker Launches Next-Generation Augmented Reality Navigation Display

Stryker introduced an upgraded augmented reality navigation display purpose-built for spine and orthopedic procedures, integrating heads-up guidance directly into its existing navigation software suite across connected operating rooms. The launch targets high volume academic medical centers seeking reduced procedure time and improved surgeon ergonomics during complex cases.
Signal: Confirms augmented reality visualization r
DECEMBER 2025

Medtronic Signs Multi-Facility Platform Agreement With Regional Health System

Medtronic signed a multi-year navigation and training services agreement with a major regional health system, covering equipment supply and surgeon certification services across several hospital facilities. The agreement is a supply arrangement rather than a joint venture or acquisition, extending Medtronic's multi-facility platform presence considerably.
Signal: Highlights platform standardization bundli
MARCH 2026

Brainlab Acquires Robotic Imaging Registration Software Startup

Brainlab completed the acquisition of a privately held robotic imaging registration software startup, adding specialized real time registration capability to its existing navigation platform and engineering team. The deal strengthens Brainlab's positioning to compete against leading robotic-integrated platforms across major hospital markets worldwide currently expanding.
Signal: Signals continued consolidation of special

Precision Optics and Software Licensing Exposure

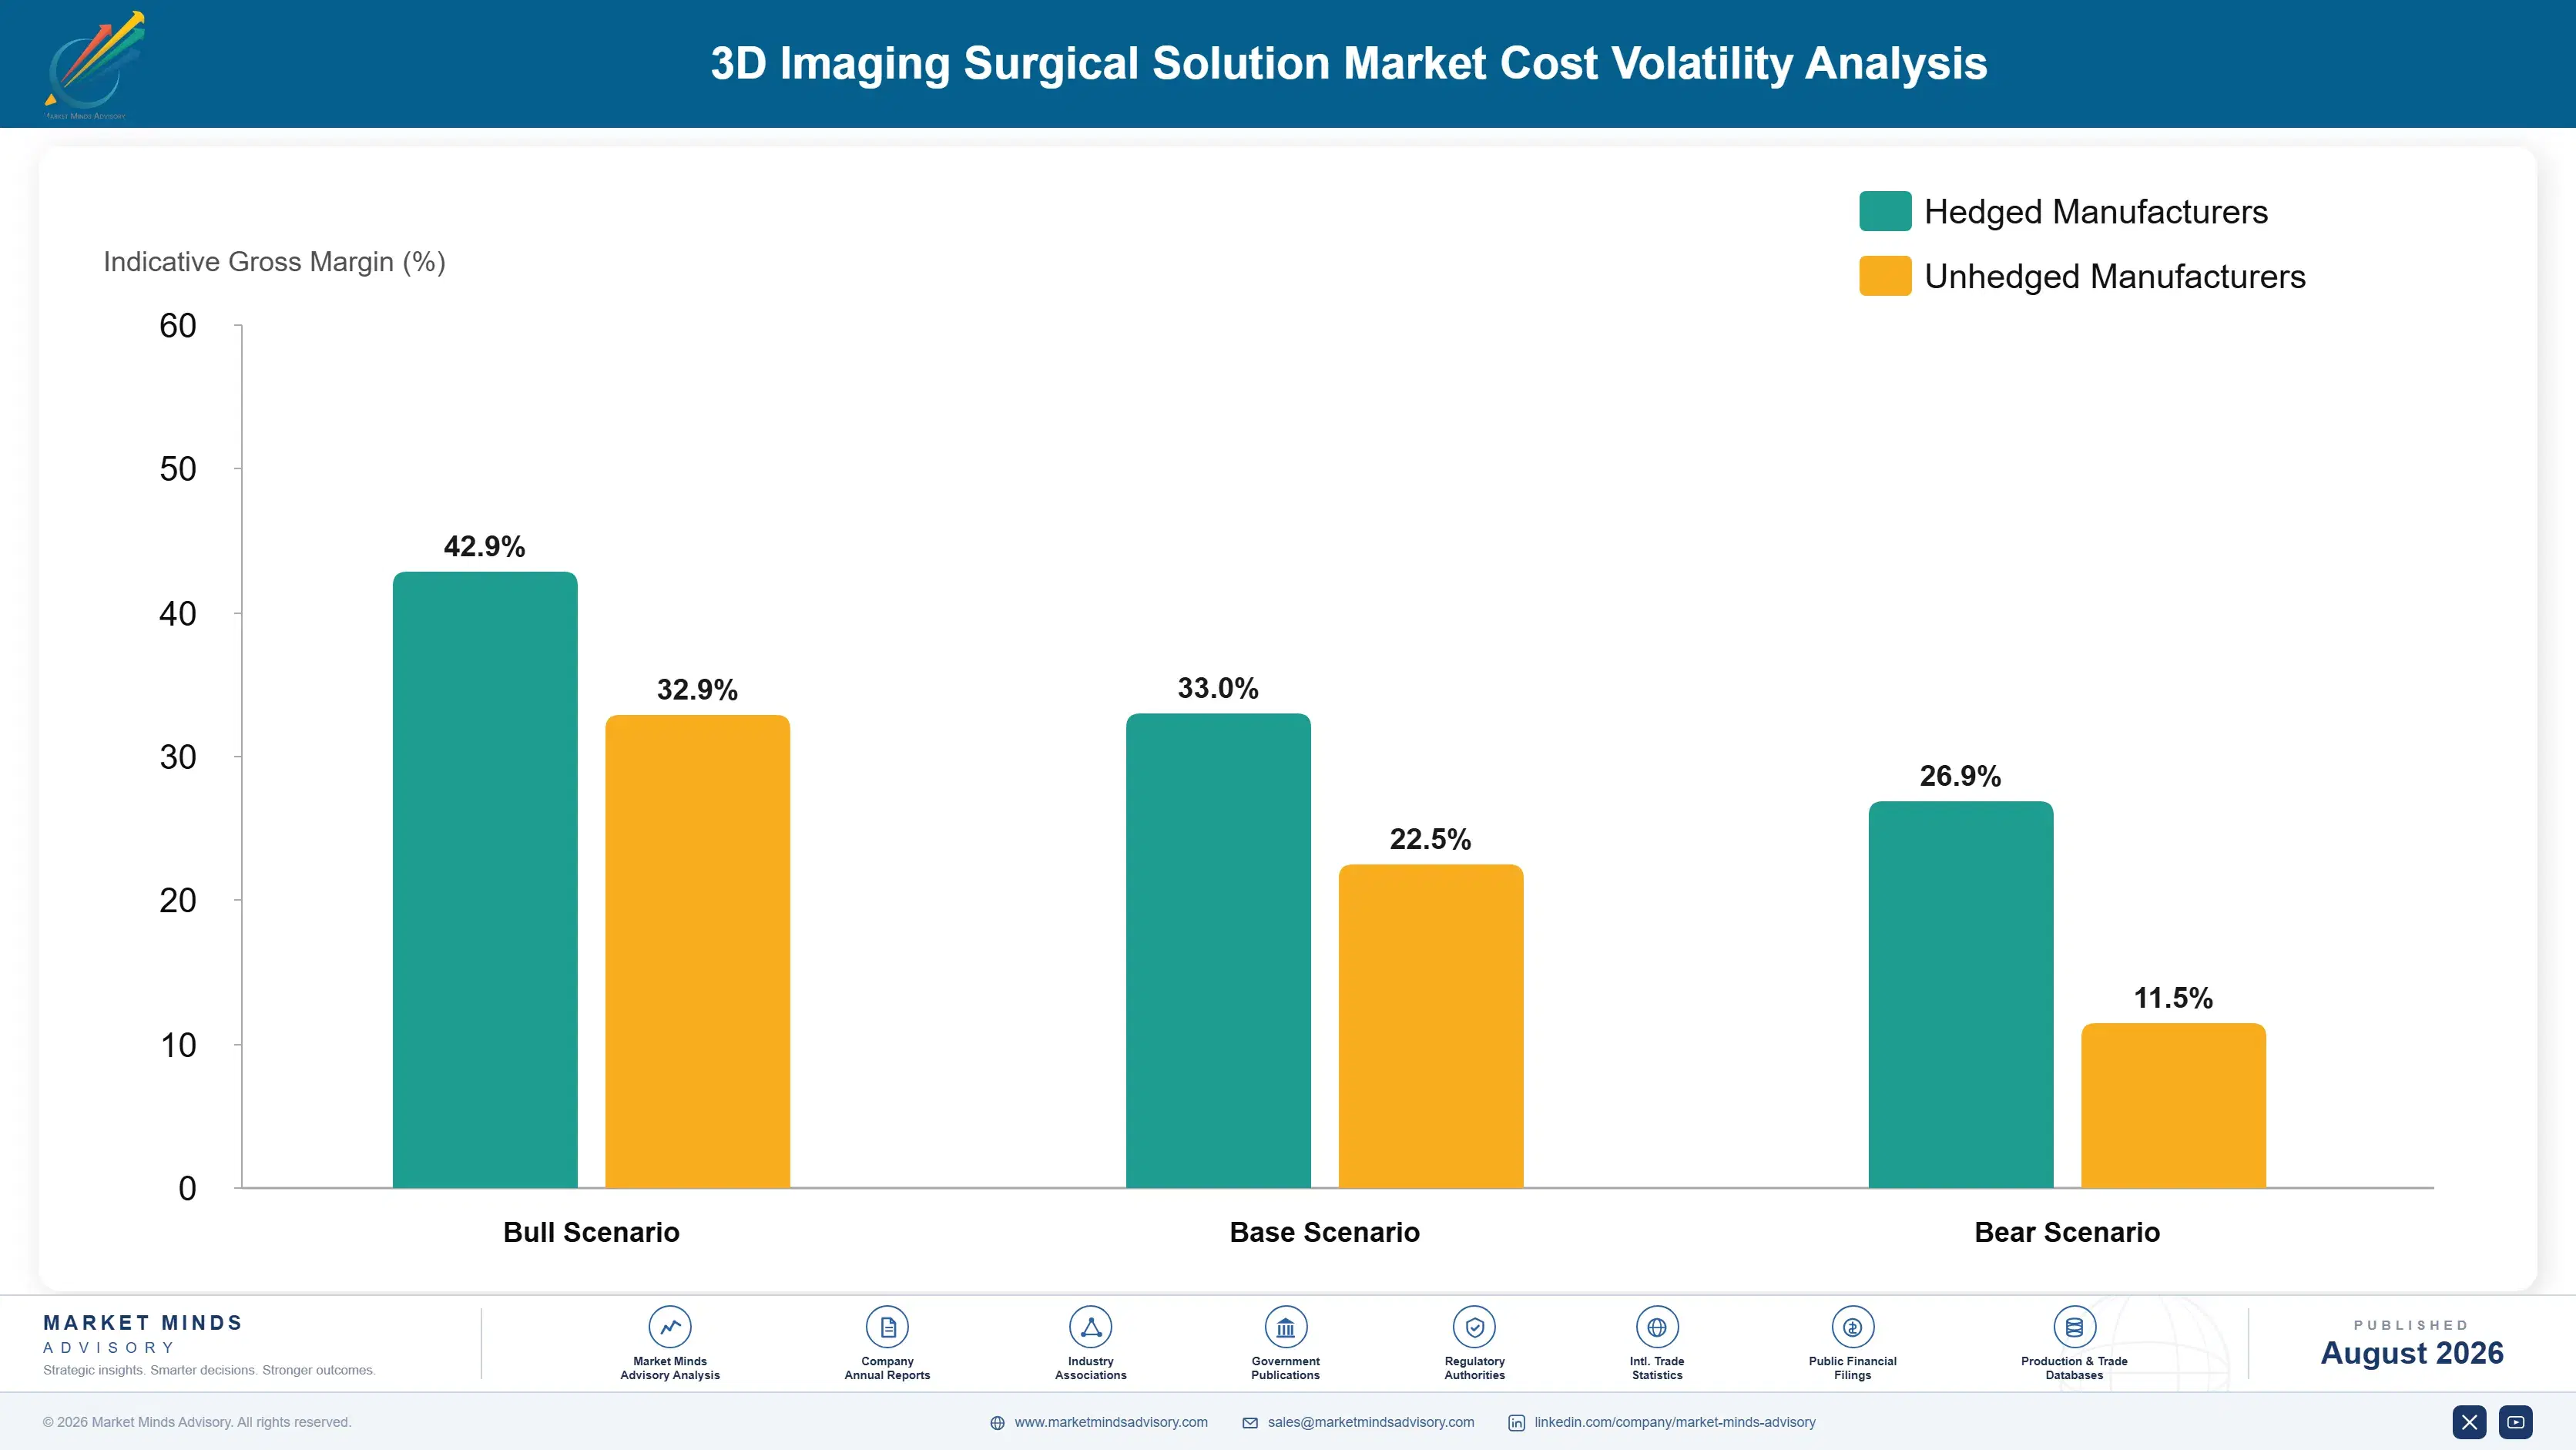
Precision optical tracking components, medical-grade computing hardware, and navigation software licensing together represent an estimated 35 to 45% of navigation platform cost of goods sold. Optical tracking component supply remains concentrated among a small number of specialty precision manufacturers worldwide, creating a narrower supply base than most broader medical device electronics categories rely upon for comparable hardware.
Semiconductor component shortages during 2021 and 2022 delayed medical-grade computing hardware production broadly, and several vendors flagged the disruption in annual reports as a persistent cost pressure affecting multiple medical device categories simultaneously. Several vendors disclosed that precision optical tracking component lead times stretched beyond sixteen weeks during the tightest period, forcing some navigation platform makers to delay system delivery or substitute costlier secondary market components to maintain commitments to hospital construction and renovation schedules.

Smaller regional vendors carry disproportionate exposure to these input swings since they lack the purchasing scale to negotiate multi-year fixed pricing directly with optical component and semiconductor suppliers that the top five vendors secure. This gap is widest for vendors dependent entirely on third-party augmented reality display licensing, leaving them more vulnerable to margin compression during licensing cost increases than diversified competitors able to shift toward internally developed visualization capability.
3d-imaging-surgical-solution-market-cost-volatility-analysis-1787303854913

Multi-Sourcing Precision Optical Tracking Components

Leading vendors now qualify at least two precision optical tracking suppliers per navigation platform, avoiding the single-source exposure that stretched lead times beyond sixteen weeks during the 2021 to 2022 shortage and protecting delivery commitments ahead of hospital construction and renovation schedules across major markets worldwide, a practice smaller regional vendors still struggle to replicate at scale.

Long-Term Medical Computing Hardware Supply Contracts

Top five vendors increasingly lock multi-year pricing directly with medical-grade computing hardware suppliers, smoothing input costs and insulating margin from the spot price volatility smaller regional vendors remain exposed to directly, a practice that has become standard procurement policy since the 2021 shortage cycle began and now covers most major hardware categories these platforms depend on.

In-House Augmented Reality Software Development

Leading vendors are increasingly developing augmented reality visualization capability internally rather than licensing entirely from third-party display providers, reducing exposure to licensing cost increases and giving vendors tighter control over integration with their existing navigation software already deployed across hospital customer sites and surgical suites nationwide, while shortening feature certification cycles.

Portfolio Architecture for Margin Defence

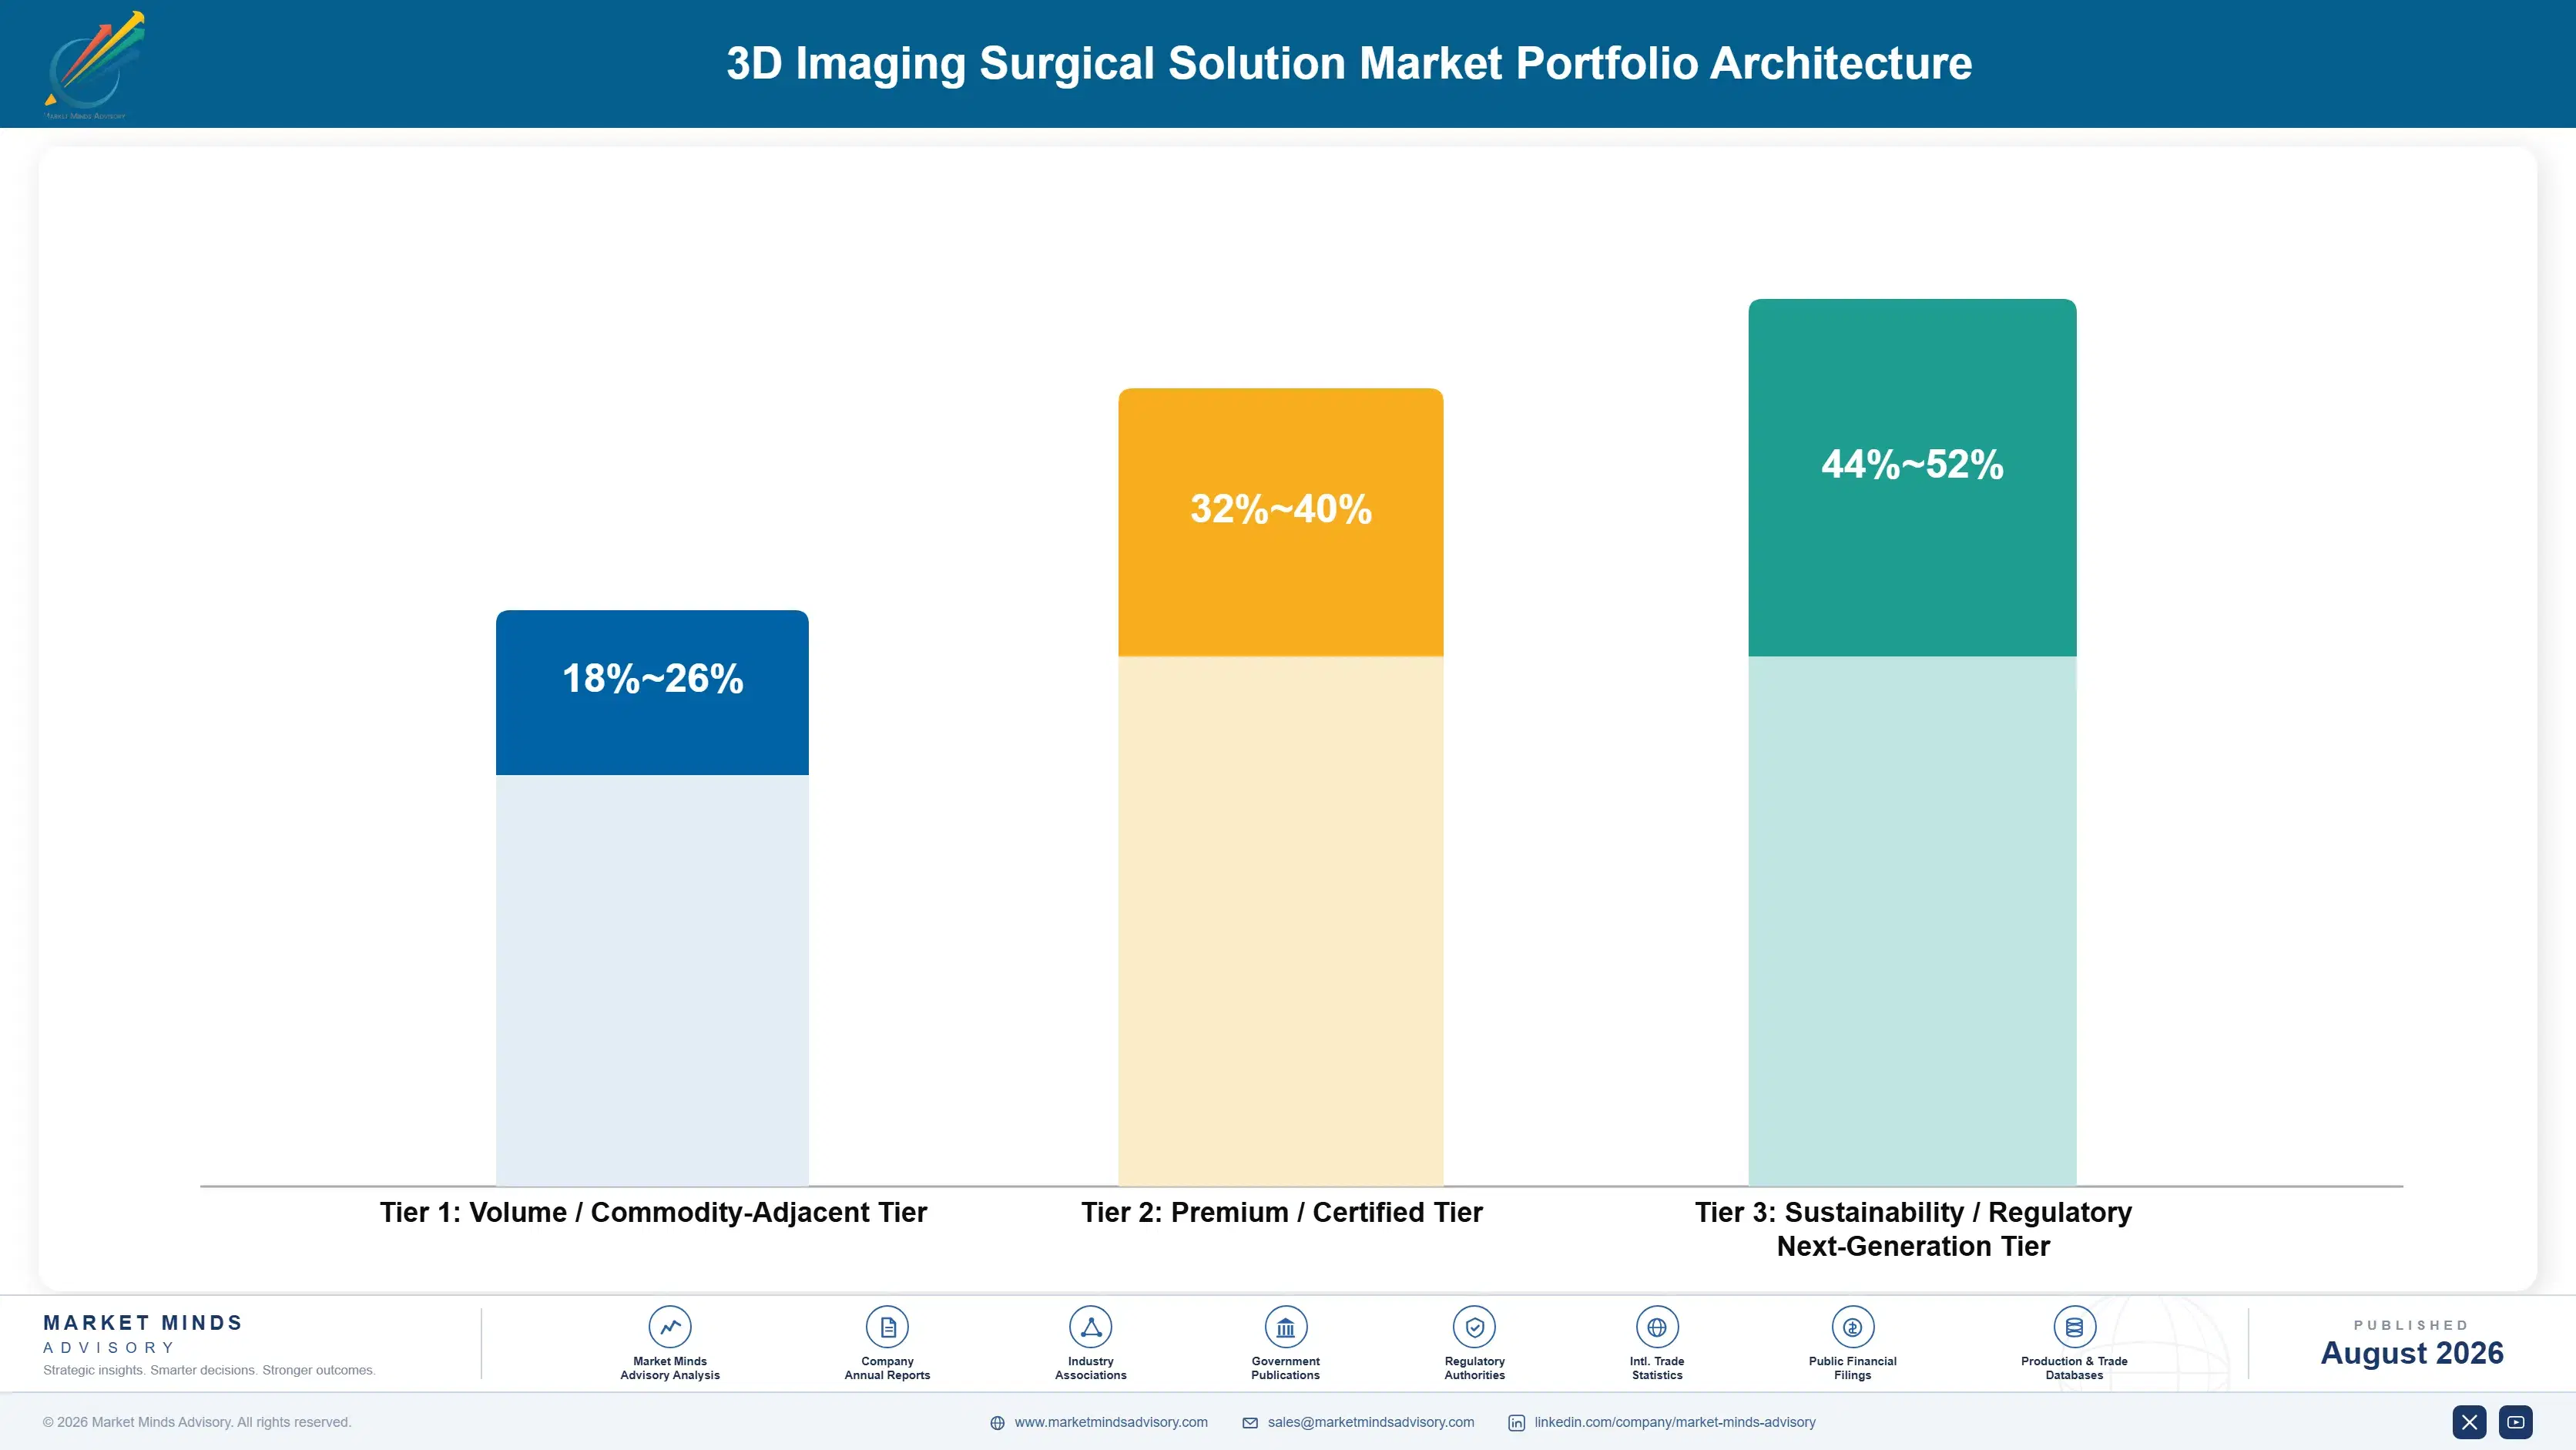
Portfolio architecture splits across three tiers: entry priced standalone imaging hardware competing largely on cost, certified navigation and robotic-imaging integration systems carrying clinical evidence value that commands a durable price premium, and next generation augmented reality-integrated platforms bundled with training and software services. Gross margins widen meaningfully moving up this ladder as clinical evidence and surgeon training barriers concentrate hardest at the entry tier.
The volume versus premium tension is sharpest in standalone imaging hardware, where regional import competition has compressed prices fastest, pushing established vendors to defend share through training and service bundling rather than matching import pricing directly on hardware alone. Augmented reality-integrated platforms retain the strongest pricing power because clinical evidence and multi-year platform relationships discourage hospitals from switching vendors mid-portfolio, a dynamic strengthening as reimbursement mandates broaden across smaller hospital segments.

High value margin pools concentrate in augmented reality-integrated platforms paired with continuous software subscriptions, where recurring revenue and high switching costs together support gross margins well above the portfolio average. Vendors are consequently prioritizing capital and engineering investment toward this tier even though it remains a minority of total unit volume shipped across the broader portfolio today, betting the mix shifts decisively within the decade.

Volume / Commodity-Adjacent Tier

Basic standalone intraoperative imaging hardware competing primarily on unit price against regional imports, with limited service attach and thin per-unit margins across most transactions, particularly among smaller community hospitals with constrained capital budgets.
Gross Margin: 18-26%

Premium / Certified Tier

Certified navigation and robotic-imaging integration systems serving regulated spine and orthopedic applications, where clinical evidence and platform relationships support durable pricing across the industry, especially among academic centers managing high surgical volumes.
Gross Margin: 32-40%

Sustainability / Regulatory / Next-Generation Tier

Augmented reality-integrated navigation platforms bundled with continuous software updates, training, and clinical support services, sold on recurring workflow value rather than hardware alone, increasingly the default specification for new operating room capacity.
Gross Margin: 44-52%
3d-imaging-surgical-solution-market-portfolio-architecture-1787303855419

Platform Agreements Anchor Recurring Revenue

Navigation platform economics function increasingly like an annuity once a connected system is installed, since continuous software subscriptions, training contracts, and periodic certification renewal generate recurring revenue for years after the initial platform sale closes. This recurring layer now represents a growing share of total category revenue and is the primary reason vendors compete aggressively on initial platform placement even at thin entry tier margins, treating the first sale a
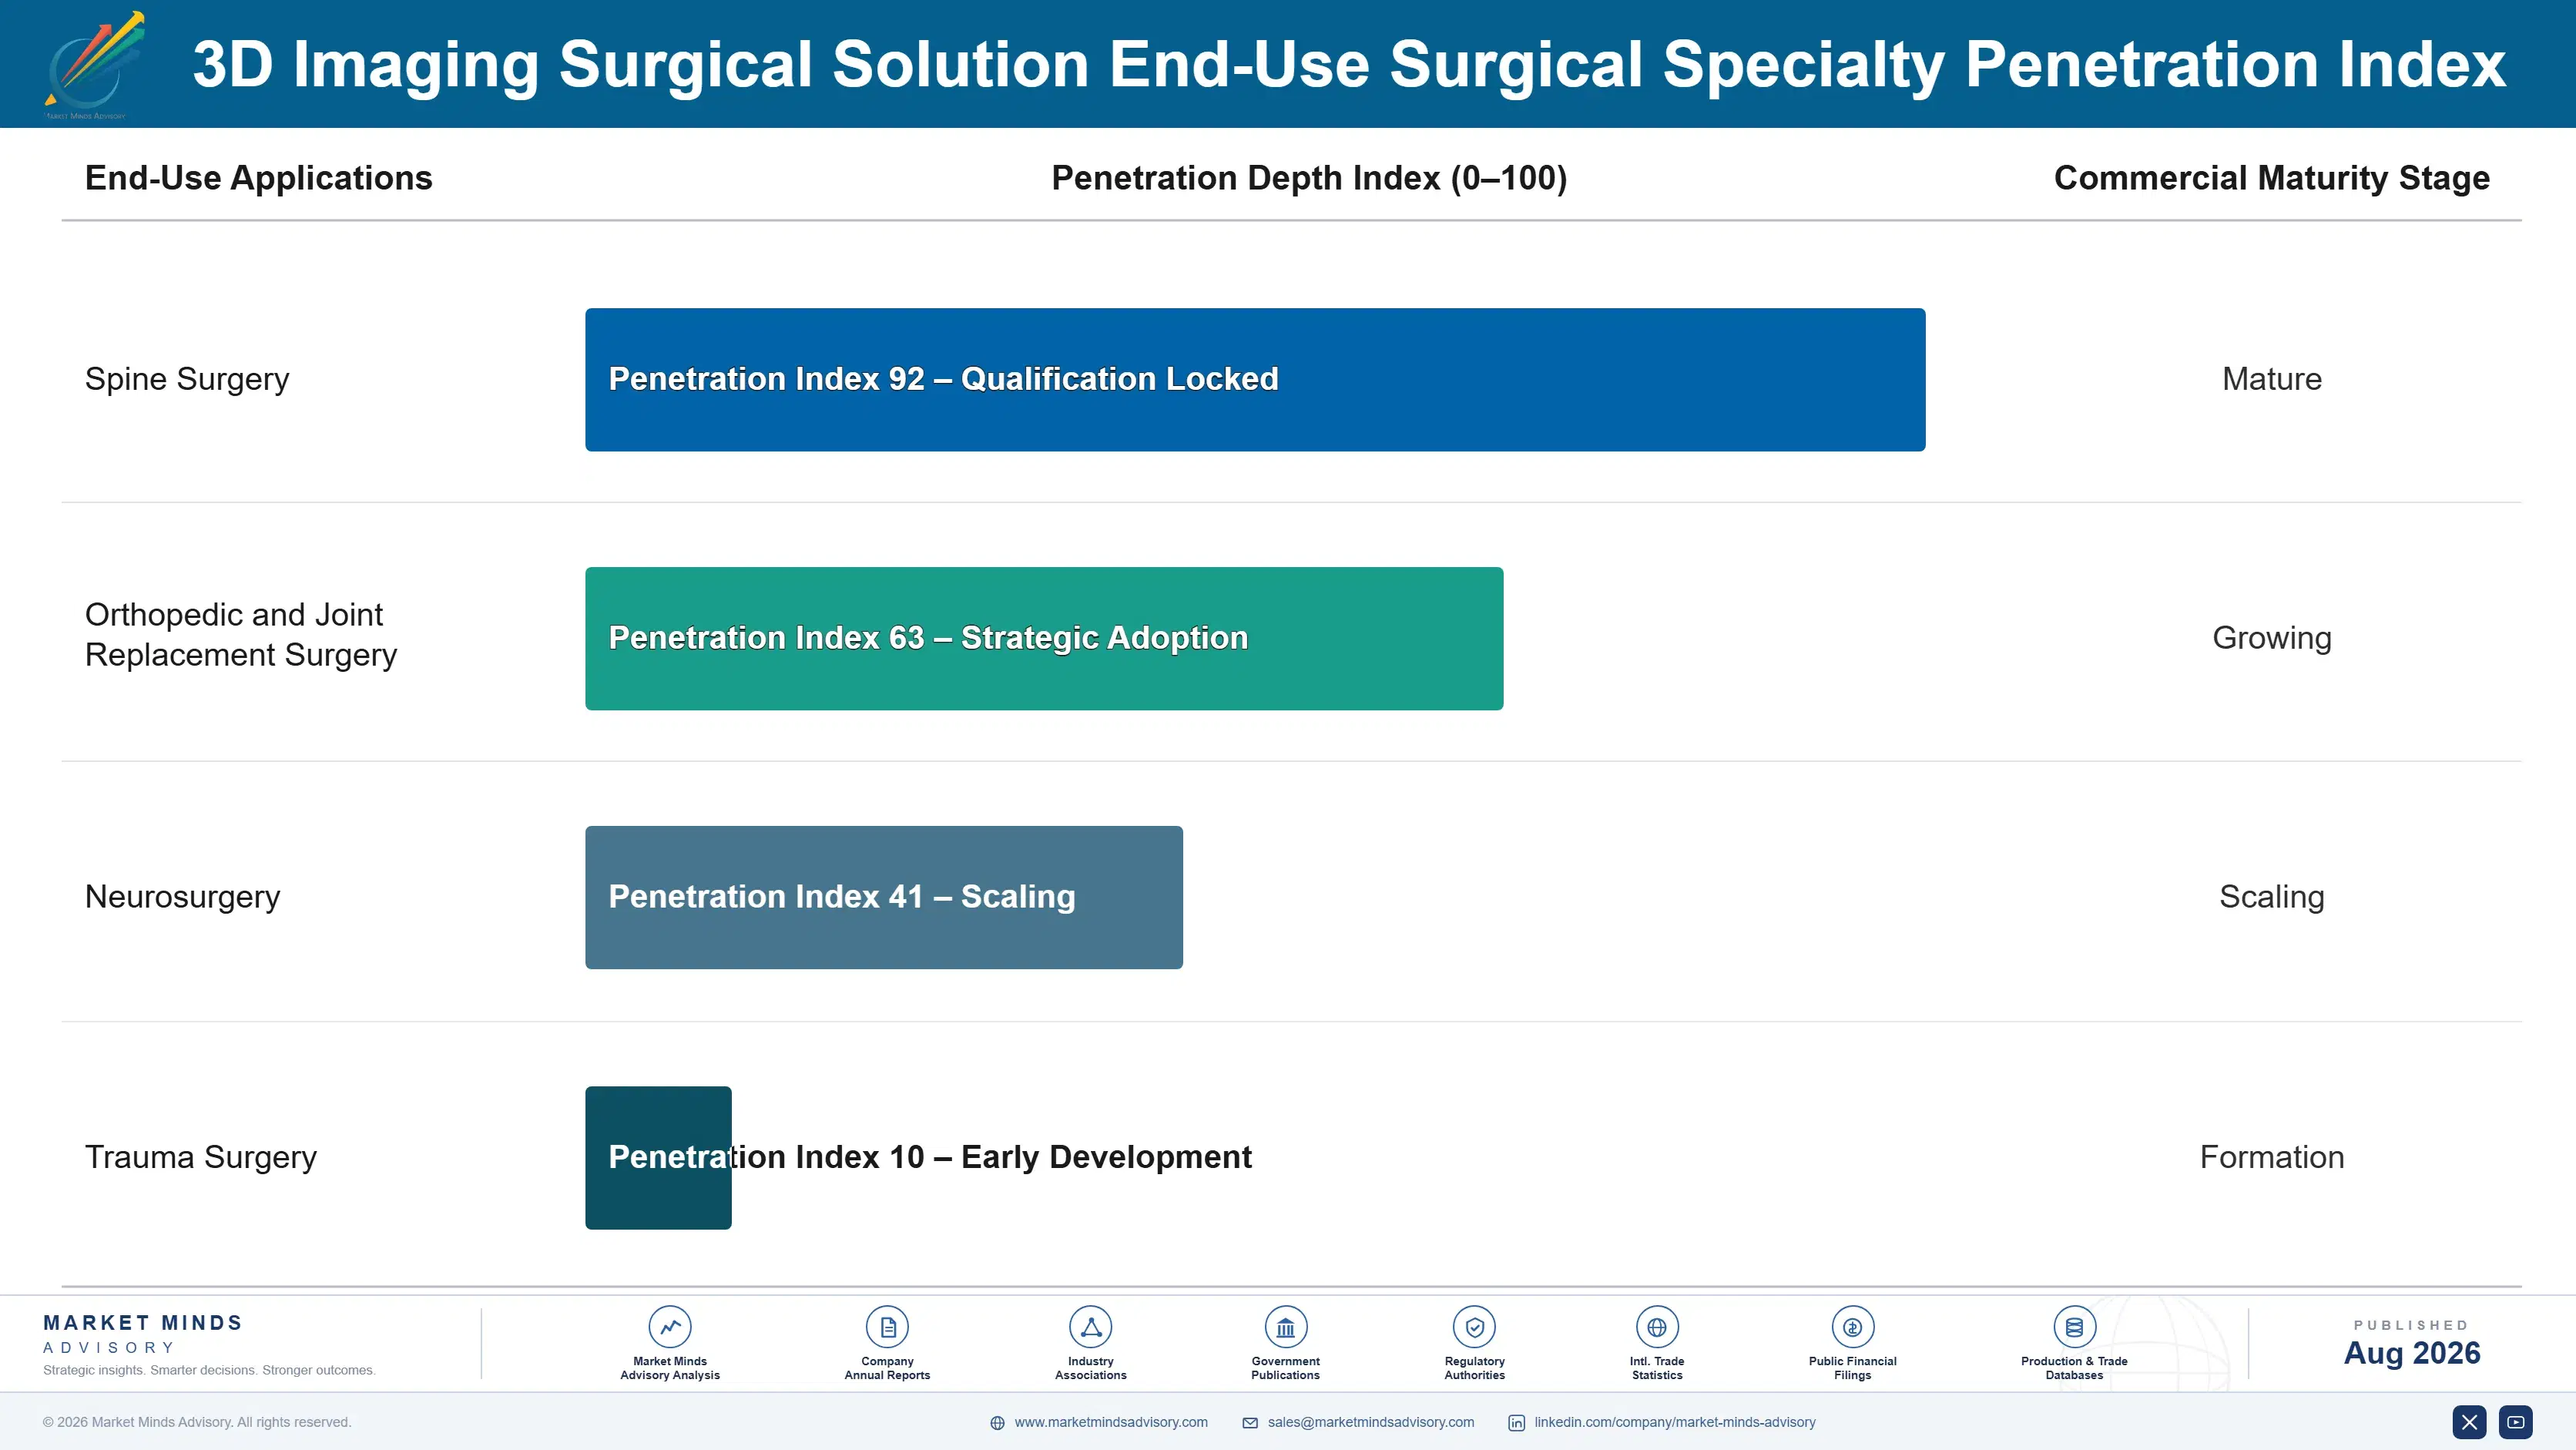
Adoption depth varies sharply by end use vertical. Large academic spine and orthopedic centers run near saturated navigation platform coverage and generate mostly replacement and software subscription demand, while mid-sized community hospitals are still building out first time navigation coverage, generating a different mix of new installation revenue layered on top of the maturing replacement base across established markets.

Buyer profiles are shifting generationally as surgeons who trained primarily on navigation-guided technique during residency increasingly influence procurement decisions alongside veteran surgeons who remember when freehand technique handled nearly every spine and orthopedic procedure. This is accelerating demand for platforms with strong software usability even among buyers who historically evaluated surgical equipment purely on mechanical imaging accuracy and hardware specifications alone.
3d-imaging-surgical-solution-market-end-use-penetration-index-1787303855908

Where Surgical Navigation Strategy Should Focus

These are among the four positions where our research anticipates prominent divergence between winners and laggards over the coming forecast period. Each is grounded in the demand model, the regulatory perimeter, and the announced capacity pipeline.
01 / AUGMENTED REALITY PLATFORM INVESTMENT

Prioritize AR visualization credentials over raw imaging resolution claims

Imaging resolution has become table stakes across certified vendors, no longer a meaningful differentiator in vendor selection for large academic hospital systems. Buyers now evaluate augmented reality visualization capability and clinical evidence depth ahead of marginal resolution gains that once justified a premium on their own. Vendors that continue competing primarily on image quality specifications risk losing share to platform focused rivals bundling hardware, training service, and software subscriptions into a single recurring revenue relationship that is far harder to unwind once established across a multi-facility account.
02 / SERVICE MONETIZATION STRATEGY

Shift commercial models toward training and software subscription revenue

Hardware margins will keep compressing as regional imports gain share at the entry tier of the category. Vendors that convert continuous software access, surgeon training, and certification renewal into contracted recurring revenue will outperform peers still pricing primarily around one-time hardware sales alone. This shift also raises customer switching costs meaningfully, since replacing a connected platform requires displacing an entrenched, multi-year training and workflow relationship built over years of accumulated surgeon trust across every managed facility in the hospital network.
03 / REGIONAL GROWTH PRIORITIZATION

Weight investment toward South Asia and East Asia over mature markets

South Asia and East Asia are compounding faster than Western Europe on both share and CAGR, driven by hospital modernization programmes, rising insurance penetration, and first time equipment installation across previously underserved provincial hospital networks. Vendors weighting sales and training investment toward these regions ahead of competitors will capture a disproportionate share of first time installation revenue. Mature markets, running mostly on replacement cycles, simply cannot replicate that category of demand at comparable scale or growth rate over the coming decade of forecast activity.
04 / LEGACY SYSTEM RESPONSE

Build simplified retraining pathways for competitive platform switching

The installed base of first-generation navigation systems represents a substantial replacement and platform switching opportunity that most vendors are not yet equipped to capture efficiently given steep surgeon retraining requirements. Vendors that develop simplified onboarding and structured proctoring programmes will be better positioned to win competitive switching contracts without the extended retraining timelines currently discouraging some surgeons from changing platforms. Vendors ignoring this opportunity risk ceding a growing replacement market to specialists who solve the retraining problem first and capture the resulting platform relationship.

Engagement Snapshot From the Field

A live engagement with an industry participant carrying material or product regulatory and market exposure ahead of a defining policy shift, showing how our research translates into a defensible multi-year portfolio strategy.
MARKET MINDS ADVISORY · CLIENT ENGAGEMENT SUMMARY
3D Imaging Surgical Solution Producer Strategic Portfolio Review and Transition Roadmap 2026·Investment Scenario on 3D Imaging Surgical Solution Exposure Evaluation 2025-26
CLIENT PROFILE
The client operates a multi-hospital academic health system across the southeastern United States, generating revenue in the low single digit billions from surgical and inpatient operations (client-reported, unverified by MMA). Its navigation fleet spanned nearly fifteen years of first and second generation systems from multiple vendors, managed without centralized software update scheduling or standardized surgeon training across its distributed hospital network.
STRATEGIC CHALLENGE
Following a system-wide capital planning review, corporate leadership sought to standardize on a single navigation and augmented reality platform across all surgical facilities within twenty four months, while minimizing operational disruption during the phased rollout across continuously operating surgical suites and complex on-call surgeon scheduling arrangements across every participating facility.
MMA APPROACH
MMA benchmarked five candidate vendors against augmented reality capability, surgeon training programme depth, and total cost of ownership over a ten year horizon, then modeled rollout sequencing to minimize simultaneous facility-level disruption across the client's highest volume surgical sites during the phased platform standardization programme currently under review by clinical and finance leadership.
KEY FINDINGS
  1. Three of five vendors evaluated could not demonstrate reliable augmented reality integration with the client's existing robotic surgery platforms at scale across every facility reviewed.
  2. Phased platform standardization reduced projected implementation cost by 31% versus simultaneous system-wide replacement across comparable facilities, based on vendor quotes gathered during evaluation (client-reported, unverified by MMA).
  3. Centralizing surgeon training was projected to cut new hire onboarding time by roughly forty percent across all participating facilities combined, according to internal workforce modeling.
  4. Facilities with the oldest navigation generations carried the highest near term clinical risk, reprioritizing the client's original rollout sequence considerably ahead of the initial twenty four month plan.
CLIENT PROFILE
The client operates a multi-hospital academic health system across the southeastern United States, generating revenue in the low single digit billions from surgical and inpatient operations (client-reported, unverified by MMA). Its navigation fleet spanned nearly fifteen years of first and second generation systems from multiple vendors, managed without centralized software update scheduling or standardized surgeon training across its distributed hospital network.
STRATEGIC CHALLENGE
Following a system-wide capital planning review, corporate leadership sought to standardize on a single navigation and augmented reality platform across all surgical facilities within twenty four months, while minimizing operational disruption during the phased rollout across continuously operating surgical suites and complex on-call surgeon scheduling arrangements across every participating facility.
MMA APPROACH
MMA benchmarked five candidate vendors against augmented reality capability, surgeon training programme depth, and total cost of ownership over a ten year horizon, then modeled rollout sequencing to minimize simultaneous facility-level disruption across the client's highest volume surgical sites during the phased platform standardization programme currently under review by clinical and finance leadership.
KEY FINDINGS
  1. Three of five vendors evaluated could not demonstrate reliable augmented reality integration with the client's existing robotic surgery platforms at scale across every facility reviewed.
  2. Phased platform standardization reduced projected implementation cost by 31% versus simultaneous system-wide replacement across comparable facilities, based on vendor quotes gathered during evaluation (client-reported, unverified by MMA).
  3. Centralizing surgeon training was projected to cut new hire onboarding time by roughly forty percent across all participating facilities combined, according to internal workforce modeling.
  4. Facilities with the oldest navigation generations carried the highest near term clinical risk, reprioritizing the client's original rollout sequence considerably ahead of the initial twenty four month plan.
RECOMMENDED STRATEGY
Phase 1: Phase 1 (Months 1-8): Pilot platform standardization at the three highest volume surgical facilities identified through careful review of case mix and equipment age. Phase 2: Phase 2 (Months 9-18): Scale the validated standardization programme across remaining academic and community facilities in strict clinical priority order. Phase 3: Phase 3 (Months 19-24): Integrate all facilities into a single corporate clinical analytics dashboard with automated outcome reporting fully enabled for leadership.
OUTCOME
The client completed platform standardization across all priority facilities within the twenty four month window and reported meaningfully improved surgeon satisfaction and onboarding efficiency during subsequent internal clinical reviews (client-reported, unverified by MMA). Corporate clinical leadership gained standardized outcome visibility previously unavailable across its distributed academic health system network.

Frequently Asked Questions

Foundational context covering the market sizes, CAGR, scope, country, region and competition that inform every finding below. This section is provided to cover basics and most often pre-purchase conversations, answered from the MMA Primary Research Dataset.

What is the current size of the 3D Imaging Surgical Solution Market?

The global 3D imaging surgical solution market reached an estimated $3.8 billion in 2025. Growth is driven by rising spine and orthopedic procedure volumes and expanding augmented reality visualization adoption.

How large will the 3D Imaging Surgical Solution Market be by 2036?

The market is projected to reach approximately $10.3 billion by 2036, roughly 2.48 times its 2026 value. Augmented reality visualization and robotic-imaging integration drive most of the added value.

What is the CAGR for the 3D Imaging Surgical Solution Market 2026 to 2036?

The base case CAGR is 9.5% through 2036. Bull and bear scenarios range from roughly 8.3% to 10.7%, depending on reimbursement expansion pace and robotic adoption timing.

Which segment is growing fastest?

Augmented reality surgical visualization systems lead at a 15.8% CAGR, about 1.66x the overall market rate. Growth is concentrated among academic centers adopting heads-up navigation display technology.

Who are the major companies in the 3D Imaging Surgical Solution Market?

Stryker, Medtronic, Brainlab, Zimmer Biomet, and GE Healthcare lead the category. Combined, the top five suppliers hold roughly 62% of global revenue on a consistent company revenue basis.

Which country is growing fastest?

China leads country level growth at an estimated 13.2% CAGR. Rapid hospital modernization and expanding surgical training capacity are driving first time navigation installation across provincial facilities.

Report Segmentation Architecture

The full report scope spans multiple orthogonal segmentation dimensions, with cross-tabulated demand data provided for each dimension pair. Coverage extends further to regional breakdowns, trend trajectories, and the competitive detail needed to support segment-level decision-making.

By System Type

  • Intraoperative Imaging Hardware
  • Surgical Navigation Software
  • Augmented Reality Visualization Systems
  • Robotic-Imaging Integration Platforms
  • Patient-Specific Surgical Guides
  • Data Management Systems

By End-Use Surgical Specialty

  • Spine Surgery
  • Orthopedic and Joint Replacement Surgery
  • Neurosurgery
  • Trauma Surgery

By Commercial Dimension

  • Direct Capital Equipment Sales
  • Distributor and GPO Channel Sales
  • Rental and Shared-Service Programs
  • Software and Training Service Contracts

By Region

  • North America
  • Western Europe
  • East Asia
  • South Asia and Pacific
  • Latin America
  • Middle East and Africa
  • Eastern Europe

Scope, Methodology, and Coverage

Every figure in this report is reproducible from documented input assumptions. The scope below maps the historical period, the forecast horizon, the segmentation dimensions, and the countries covered, alongside the underlying primary and qualitative methodology.
Historical Period
2020 to 2025
Forecast Period
2026 to 2036
Base Year
2025 (USD billions; MMA Primary Research Dataset, August 2026)
Market Definition
The 3D imaging surgical solution market covers intraoperative three dimensional imaging hardware, surgical navigation software, and augmented reality visualization systems used to guide spine, orthopedic, neurosurgical, and trauma procedures in real time. It includes mobile and fixed intraoperative CT and cone-beam imaging systems, navigation platforms, and the patient-specific guides derived from preoperative imaging data.
Quantitative Units
USD billions (current prices); installed navigation system count where disclosed
Segmentation Dimensions
By System Type; By End-Use Surgical Specialty; By Commercial Dimension; By Region
Regions Covered
North America, Western Europe, East Asia, South Asia and Pacific, Latin America, Middle East and Africa, Eastern Europe
Countries Covered
USA, China, Germany, France, UK, Japan, South Korea, India, Australia, Canada, Brazil, Mexico, Indonesia, Vietnam, Thailand, Malaysia, UAE, Saudi Arabia, South Africa, Nigeria, Turkey, Poland, Netherlands, Italy, Spain, Sweden, Switzerland, Argentina, Colombia, Singapore, and additional markets relevant to this sector
Key Companies Profiled
Stryker, Medtronic, Brainlab, Zimmer Biomet, GE Healthcare, Siemens Healthineers, Canon Medical Systems, Philips Healthcare, KARL STORZ, Olympus Corporation, NuVasive, Globus Medical, Smith & Nephew, B. Braun Melsungen, Fujifilm Holdings, Intuitive Surgical, Carestream Health, Materialise NV, Elekta AB, Hologic Inc
Quantitative Methodology
Primary survey, n=3,800 respondents, Q4 2025, six countries; demand-side model with trade association cross-validation
Qualitative Methodology
47 expert interviews, Q4 2025; applied to validate demand model assumptions, identify emerging dynamics, and assess competitive positioning
Report Format
PDF and XLSX data workbook (Word format preview document)
Publisher
Market Minds Advisory
Report Code
MMA-2026-MED-130
Published
August 2026
Contact
sales@marketmindsadvisory.com | www.marketmindsadvisory.com

Purchase the full 3D Imaging Surgical Solution Market Report (2026 to 2036).

The full report delivers a complete quantitative and qualitative assessment of the global 3D imaging surgical solution market through 2036. It includes detailed segmentation by system type, surgical specialty, and commercial channel, alongside country level sizing across thirty markets covering every major surgical demand center. Competitive profiles cover twenty companies with capability, clinical evidence, and service network benchmarking assessed on a consistent revenue basis. Buyers also receive access to the underlying primary survey and expert interview datasets referenced throughout the analysis, along with editable data tables.
Segment level CAGR and sizing tables
Regional and country level market breakdowns
Twenty company competitive profiles and benchmarks
Detailed augmented reality capability benchmarking matrix
Input cost and supply chain risk analysis
Primary survey and expert interview datasets

Built For The People Who Decide

From boardroom strategy to bench-side execution, this report is read cover-to-cover by leaders shaping the next decade of their industry, turning demand scenarios, market dynamics and valuation benchmarks into decisions.
CXOs/ Presidents/ VPs/ Managers
M&A and Corporate Development
Strategy Teams and R&D Heads
Procurement and Product Directors
Regulatory and Compliance Leaders
Investor Relations and Equity Analysts