Market Minds Advisory
3D Glasses Market

3D Glasses Market: 3D Glasses Market: Venue Replacement Cycles, Hygiene Economics and Surviving Applications 2026 to 2036

Consumer cinema abandoned this product and the category did not die with it. What survived is theme parks, simulators and surgical displays, where nobody gets to decide they would rather not wear the glasses.

Lead Analyst

Published

September 2026

Make Smarter Decisions with Customized Research Insights

Request a free sample report and evaluate market opportunities, growth trends, and competitive dynamics relevant to your business needs.

2025 MARKET VALUE$1.4BMarket Size 2025
2036 FORECAST VALUE$2.3BBase Case , 2026 to 2036
CAGR 2026 TO 20364.6 %Bull 5.8% / Bear 3.4%
INCREMENTAL OPPORTUNITY$0.8BNet 10- year value creation
EXPANSION MULTIPLE1.53x2036 value over 2026 base
Strategic Levers
M&A Pipeline
Regional Outlook
Country Rankings
Competitive Intelligence
Segmental Deep-dive
Call-Us : 91 93563 13602

Executive Snapshot and Market Trajectory.

Consumer cinema walked away from this product entirely and the category managed to survive anyway. What kept it alive is theme parks, flight simulators, surgical displays and design visualisation, where the viewer is never asked whether they would rather not wear the glasses at all.
The market reaches USD 1.5 billion in 2026 and USD 2.3 billion by 2036, a 1.53 times expansion at 4.6% annually. Active shutter glasses for simulation and training grow at 6.9%, half again the market rate of 4.6%, because those applications need synchronised stereo that passive filters cannot deliver. East Asia holds 31% of global unit volume, and the United Arab Emirates compounds fastest of any market at 8.2% on continuing attraction construction.
Five manufacturers hold 49% of shipment revenue, and that concentration reflects how few suppliers stayed in the category after cinema demand collapsed rather than any barrier to entry. RealD, Volfoni, XPAND 3D, Depth Q and Marchon Eyewear lead what remains of the field. Venue operators replace stock on fixed cycles driven by hygiene handling and breakage rather than by anything at all to do with optical performance.
Market Definition
This report covers stereoscopic viewing eyewear by optical class: passive polarised glasses, active shutter glasses for simulation and training, anaglyph and filter glasses, interference filter and spectral separation glasses, prescription-compatible clip-on stereo lenses, and reusable venue eyewear with cleaning and handling systems. It excludes augmented and virtual reality headsets of any kind, autostereoscopic displays requiring no eyewear, projection and display hardware, laser and LED light engines, and content production or conversion services.
Base Year Value
$1.4B in 2025 (MMA Primary Research Dataset, September 2026)
Forecast Period
2026 to 2036, eleven discrete annual values
CAGR
4.6% base case. Bull 5.8%. Bear 3.4%.
Fastest Growth Segment
Active Shutter Glasses For Simulation And Training: 6.9% CAGR
Fastest Growth Country
United Arab Emirates: 8.2% CAGR
Fastest Growth Region
South Asia and Pacific: 6.5% CAGR
Largest Region
East Asia: 31% of 2025 global value
Market Leaders
RealD, Volfoni, XPAND 3D, Depth Q and Marchon Eyewear lead on stereoscopic eyewear shipment revenue. Source: MMA Analysis.
Primary Survey
n=3,800 procurement and R&D decision-makers, Q4 2025, six countries
Methodology
Demand-side build-up, cross-validated against public data, 47 expert interviews

3D Glasses Market Forecast Scenarios

3d-glasses-market-size-forecast-scenario-1789994935681
Between 2020 and 2025 the category compounded at 3.4%, recovering from a collapse rather than growing from strength. Cinema attendance fell sharply and the premium format that had justified stereo presentation lost most of its remaining audience, taking passive glasses volume down with it. What steadied the market was attraction operators, simulator programmes and medical visualisation, none of which asks the viewer whether they would prefer to watch flat.
The base case holds 4.6% on three mechanisms. Theme park and location-based attraction construction keeps adding venues that use stereo as a core effect rather than as an optional upgrade. Flight, driving and defence simulator programmes require synchronised stereo for depth judgement, which no flat display substitutes for. And surgical and design visualisation displays keep specifying stereo eyewear wherever spatial accuracy directly affects the outcome of the work being carried out.
The bull case at 5.8% assumes attraction construction across the Gulf and Asia runs ahead of announced schedules, since each venue equips its whole audience at once. The bear case at 3.4% is headset substitution: as head-mounted displays get lighter and cheaper, attraction operators may prefer them over eyewear, and one large operator switching takes considerable volume with it.

What Survived The Cinema Retreat

This is a category that lost its largest customer and kept going. Cinema stereo faded as audiences declined to pay a premium, and the passive glasses volume never returned. What remained was applications where the viewer has no vote: a ride built around a stereo effect, a simulator where depth judgement is the point, a surgical display where spatial accuracy matters to somebody on the table.
TOP FIVE CONCENTRATION49%Held by the suppliers who stayed after cinema demand collapsed
VENUE REPLACEMENT CYCLE14 monthsBefore handling damage and hygiene wear force reusable stock renewal
PASSIVE UNIT COST0.9 dollarsPer reusable polarised pair at venue purchasing volume
ACTIVE UNIT COST58 dollarsPer synchronised shutter pair used in simulation work
CLEANING COST PER CYCLE11 centsLabour and consumables for each reusable pair processed
ATTRACTION LOSS RATE7%Reusable stock lost or damaged beyond repair each quarter
The operating economics are dominated by handling rather than by optics. A reusable passive pair costs around 0.9 dollars and lasts roughly 14 months in venue service, but processing it between uses costs about 11 cents each time and around 7% of stock disappears or breaks each quarter. Venue operators run this as a labour and consumables problem. Suppliers talking about optical quality answer a question nobody in operations is asking.
The exception is active shutter eyewear at around 58 dollars per pair, selling into simulation and training where synchronised stereo is genuinely required and unit cost is irrelevant. That segment grows at 6.9% against 4.6% for the market. It is a completely different business from venue eyewear despite the superficial similarity, with different buyers, volumes and competitive dynamics entirely.
"People keep writing this category off, and they keep being half right. Consumer stereo really did die. But nobody has told the theme park operator equipping four thousand guests a day, and nobody is going to build a flight simulator that shows the pilot a flat picture."
Director, Display Optics and Visualisation Systems Practice · MMA Technology Practice · September 2026

Market Trends

Attraction Construction Replaces Cinema As Volume Driver

Theme parks and location-based attractions build stereo effects into ride design rather than offering them as an upgrade, which means every guest is equipped whether they asked to be or not. A single large attraction can consume more eyewear in a year than a substantial cinema chain, and Gulf and Asian construction programmes keep adding venues. The United Arab Emirates compounds at 8.2%, faster than any other market, on attraction development. Venue buyers purchase against quarterly loss rates near 7% and against cleaning throughput rather than against any optical specification at all.
Market Impact: Active pairs cost 58 dollars

Hygiene Handling Sets The Real Operating Cost

Processing a reusable pair between guests costs around 11 cents in labour and consumables, and a busy attraction runs thousands of pairs through that cycle every single day. That recurring cost exceeds the purchase price of the eyewear itself within months of deployment, which reorders what venue operators actually care about. Suppliers offering faster cleaning throughput, more durable frames or cheaper single-use alternatives are competing on the number that matters. Optical performance arguments reach a buyer who settled that particular question a very long time ago and has not revisited it since.
Market Impact: Approved pairs cost 58 dollars

Market Opportunities and Growth Drivers

Simulation Programmes Require Synchronised Stereo Depth

Flight, driving and defence simulators use stereo presentation because depth judgement is what the training exercise is actually assessing, and a flat display does not substitute for it in any acceptable way. Active shutter eyewear at around 58 dollars per pair sells into those training programmes, where unit cost is entirely negligible against the simulator sitting behind it. Active shutter glasses for simulation and training grow at 6.9% against 4.6% for the market. Procurement here runs through defence and aviation training budgets rather than through any entertainment or venue channel whatsoever.
Market Impact: One switch removes 100% volume

Medical Visualisation Keeps Specifying Stereo Eyewear

Surgical displays, particularly those used in minimally invasive and microsurgical procedures, present stereo imagery because spatial accuracy directly affects the outcome for the patient on the table. Those displays specify the eyewear as part of a regulated system rather than as any kind of loose accessory, which means the selection is documented and consequently changes very slowly indeed. Replacement here runs on clinical rather than on any commercial cycle, and hospital procurement teams will not substitute an unapproved alternative simply to save money on something costing 58 dollars a pair.
Market Impact: Consumer volume fell over 80%

Market Restraints and Challenges

Headset Substitution Threatens Attraction Eyewear Volume

Head-mounted displays keep getting lighter and cheaper, and an attraction operator choosing one over stereo eyewear removes that venue's entire eyewear consumption at a single stroke. The root cause is that a headset delivers a more controlled guest experience and the operator already runs a cleaning and handling operation either way. Commercially this remains the largest single downside risk to category volume anywhere in the world. Mitigation runs through guest throughput, since a headset takes considerably longer to fit, adjust and clean per guest than a pair of glasses does.
Market Impact: Loss rates near 7% quarterly

Consumer Stereo Demand Is Not Returning

Cinema and home stereo presentation lost its audience and no credible mechanism exists to bring that volume back, which caps the category at whatever the professional and attraction applications between them support. The root cause is that consumers were being asked to pay a premium and wear something uncomfortable for an effect that most of them did not value at all. Commercially this limits the total addressable market permanently rather than temporarily. Mitigation is honest positioning: suppliers forecasting consumer recovery are misallocating investment that attraction and simulation demand would actually reward.
Market Impact: Cleaning costs 11 cents each
3 additional market trends, 4 additional growth drivers, and 2 additional restraints and challenges are covered in the full report. Contact sales@marketmindsadvisory.com to access the complete intelligence.

Segment CAGR and Growth Architecture

Segmentation follows optical class, since the separation method determines unit cost, synchronisation requirement and which applications a product can serve at all. Six classes cover the market, running from passive polarised and active shutter through interference filter, anaglyph, prescription-compatible and reusable venue systems. Application setting and procurement route are separate dimensions handled elsewhere in this report.
3d-glasses-market-market-share-analysis-1789994936223

Active Shutter Glasses For Simulation And Training

Active shutter eyewear grows at 6.9%, half again the market rate of 4.6%, on applications where synchronised stereo is a technical requirement rather than a presentation preference. Flight, driving and defence simulators all assess depth judgement, and passive filter separation simply does not deliver the frame synchronisation those systems need. At around 58 dollars per pair the unit cost is entirely negligible against the simulator it supports, so procurement teams never negotiate hard on it at all. The commercial character differs completely from venue eyewear: small volumes, long approval processes, defence and aviation training budgets, and buyers who document the selection carefully and then leave it entirely alone for years afterwards.
CAGR 6.9%

Reusable Venue Eyewear With Cleaning Systems

Reusable venue eyewear with associated cleaning and handling systems compounds at 5.8% because attraction operators buy the operating solution rather than the optical product. A single pair costs around 0.9 dollars and lasts roughly 14 months in service, while processing it between guests costs about 11 cents every time and roughly 7% of stock is lost or broken each quarter. Those recurring numbers exceed the original purchase cost within months of deployment, which is precisely why cleaning throughput and frame durability decide selection here. Suppliers selling the eyewear alone are competing on the smallest single line in the operator's actual cost model for the whole activity, which rarely wins anything.
CAGR 5.8%
Full segment breakdown across 6 segments available in the complete report.

Regional Architecture and Country Demand Map

East Asia holds 31% of unit volume, ahead of every other region and above the usual band ceiling, on Chinese and Japanese attraction construction running alongside most of the world's eyewear manufacturing capacity. North America follows at 24% on established theme parks and simulator programmes.

East Asia

East Asia takes 31% of unit volume, above the 30% band ceiling, on a combination that no other region matches: heavy attraction construction and most of the world's eyewear manufacturing capacity in the same place. Chinese theme park development has added venues at a pace that nowhere else in the world approaches, and each one of them equips its full daily attendance from opening. Japanese and South Korean attractions operate at very high throughput, where cleaning cost per cycle dominates the whole operating model. Growth at 5.4% sits above the global rate. Manufacture and consumption sitting together in one region keeps unit pricing lower here than anywhere else measured worldwide.
Share: 31% | CAGR: 5.4% (2026 to 2036)

North America

Twenty-four percent of unit volume reaches North America, split between established theme park operators and a substantial simulator and defence training base. The attraction operators here run the highest daily throughput anywhere, which makes cleaning cost per cycle and loss rates near 7% quarterly the dominant operating concerns rather than anything optical. RealD and Depth Q both hold significant regional positions across attraction and simulation buyers alike. Simulator procurement runs through aviation and defence training budgets on entirely separate cycles from anything the attraction operators do. Growth at 4.2% sits below the global rate on a venue base that is already comprehensively equipped and expanding only slowly. Replacement volume dominates new equipping here.
Share: 24% | CAGR: 4.2% (2026 to 2036)
Regional intelligence for 5 additional markets available in the complete report: Western Europe, South Asia and Pacific, Latin America, Middle East and Africa, Eastern Europe. Contact sales@marketmindsadvisory.com.
3d-glasses-market-country-cagr-analysis-1789994936763

Where This Category Still Pays

Handling cost exceeds the purchase cost within months of deployment, the consumer volume is quite plainly not coming back, and every application that survived is one where nobody ever asks the viewer whether they would rather not wear the glasses. The four levers below follow those facts rather than any argument about optical quality.

Sell The Handling Operation, Not The Eyewear

A reusable pair costs around 0.9 dollars while processing it between guests costs about 11 cents every cycle, so the recurring handling cost overtakes the purchase price within months of deployment at any real throughput. Venue operators run this entirely as a labour and consumables problem and evaluate their suppliers accordingly. Suppliers offering faster cleaning throughput, more durable frames or genuinely cheaper single-use options are competing on the number the operator actually manages. Optical performance arguments reach a buyer who settled that particular question a very long time ago indeed.
Market Impact: Cleaning costs 11 cents on every single cycle

Equip New Venues Before They Open

A newly built attraction equips its entire daily audience from opening day rather than replacing anything, which is a completely different purchase from a replacement order at an operating venue. The United Arab Emirates compounds at 8.2% and Saudi and Asian construction programmes keep adding sites. Reaching those projects means engaging with attraction designers and construction programmes rather than with venue operations teams, because the eyewear specification is settled during fit-out rather than through any later procurement process at the operating venue. Quarterly loss rates then generate recurring volume afterwards.
Market Impact: New venues equip 100% of their daily audiences

Serve Simulation Buyers As A Separate Business

Active shutter eyewear at around 58 dollars per pair sells into flight, driving and defence simulators, where synchronised stereo is a hard technical requirement and unit cost is negligible against the programme it supports. That is a different business from venue eyewear in every single respect: small volumes, long approval processes, defence and aviation training budgets, and carefully documented selections that then persist for years. Suppliers running both of these businesses through a single commercial organisation consistently underserve whichever of the two happens to be the smaller one for them.
Market Impact: Simulation pairs cost 58 dollars for each pair

Defend Guest Throughput Against Headset Substitution

Head-mounted displays keep getting lighter and cheaper, and an attraction operator switching across to them removes that venue's entire eyewear consumption in a single decision that nobody then revisits. The defensible ground here is guest throughput, since a headset takes considerably longer to fit, adjust and then clean per guest than glasses do, and guest throughput ultimately determines revenue per hour at any attraction anywhere. Suppliers quantifying that difference in guests processed per hour against an 11 cent cleaning cycle are arguing on the operator's own terms rather than on product ground.
Market Impact: One decision removes 100% of a venue's volume

Who Controls the Margin Pool

Five manufacturers hold 49% of stereoscopic eyewear shipment revenue, and that concentration reflects how few suppliers stayed in the category after cinema demand collapsed rather than any barrier to entry. RealD, Volfoni, XPAND 3D, Depth Q and Marchon Eyewear lead. All participants here are assessed consistently on stereoscopic eyewear shipment revenue rather than on any broader optical or display business they may also operate.
Competition runs on handling economics in venue applications and on approval status in simulation and medical ones, which are two entirely separate contests fought against different buyers. Venue suppliers compete on cleaning throughput, durability and cost per cycle. Simulation and medical suppliers compete on synchronisation performance and on being the documented part in an approved system, where unit price barely enters the discussion at all and approval status decides everything.

Pressure comes from head-mounted display suppliers reaching attraction operators directly with an entirely different answer to the same guest experience problem, and one large operator switching takes real volume with it. Rankings shift where new venues are built rather than where existing ones replace stock, particularly across the Gulf, China and Southeast Asia where construction continues at pace.
3d-glasses-market-company-positioning-matrix-1789994937292

Competitive Moat and Risk Dimensions

REALD

Moat: Venue System Integration

RealD supplies eyewear alongside the projection and polarisation systems it works with, so the venue buys a working arrangement rather than assembling one from parts that may not match. That position was built during the cinema period and transferred to attractions largely intact. Competitors selling eyewear alone must convince the operator their product works with equipment somebody else supplied.
REALD

Risk: Cinema Legacy Concentration

A position built around cinema installation carries exposure to a customer base that has shrunk and shows no sign of recovering. Attraction operators buy on handling economics rather than on system integration heritage, and they are perfectly willing to source eyewear separately. The transferable value of a cinema relationship declines every year that installed base contracts further.
VOLFONI

Moat: Attraction Operator Relationships

Volfoni built direct relationships with attraction and location-based entertainment operators rather than depending on cinema channels, which placed the company in the part of the market that grew while the other part collapsed. Those operators buy repeatedly against loss rates and replacement cycles, so the relationship generates recurring volume. Reaching those buyers requires understanding venue operations rather than optical specification.
VOLFONI

Risk: Headset Substitution Exposure

Attraction operators are exactly the buyers most likely to consider head-mounted displays instead, since they already run cleaning and handling operations and want a controlled guest experience. One large operator switching removes considerable volume permanently. Defending the position requires demonstrating guest throughput advantages rather than arguing about image quality between the two approaches.

Players Tracked

Prominent Players

RealD
Volfoni
XPAND 3D
Depth Q
Marchon Eyewear

Other Key Players

Barco
Christie Digital Systems
Dolby Laboratories
MasterImage 3D
Oculus3D
Bolex International
Sharp NEC Display Solutions
Optoma
Epson
Panasonic Connect
Vuzix
Shenzhen Sinorama
Hangzhou Hanhui Optics
Cinemeccanica
IMAX Corporation

Recent Developments

MAY 2025

Gulf Attraction Programmes Commission Further Entertainment Venues

Attraction operators across the United Arab Emirates and Saudi Arabia commissioned further entertainment venues incorporating stereo ride experiences, capacity development rather than any corporate transaction. A newly built attraction equips its entire daily audience from opening day rather than replacing existing stock, which concentrates eyewear demand into the fit-out period.
Signal: New construction equips entire audiences at once, which replacement orders at operating venues simply never do.
OCTOBER 2024

Attraction Operators Adopt Faster Eyewear Cleaning Systems

Several large attraction operators adopted higher throughput eyewear cleaning and handling systems across their venues, an operational investment rather than any merger. Processing a reusable pair between guests costs around 11 cents in labour and consumables, which exceeds the purchase price of the eyewear itself within months of deployment.
Signal: Handling cost overtakes purchase cost quickly, so operators end up buying the process rather than the product.
FEBRUARY 2025

Simulator Programmes Extend Synchronised Stereo Specification

Aviation and defence simulator programmes extended specification of synchronised stereo presentation across additional training platforms, a procurement development rather than any partnership. Depth judgement is what those exercises assess, and passive filter separation does not deliver the frame synchronisation that these training systems actually require.
Signal: Where depth judgement is the assessment itself, stereo presentation stops being any kind of optional choice.

What Stereo Eyewear Costs

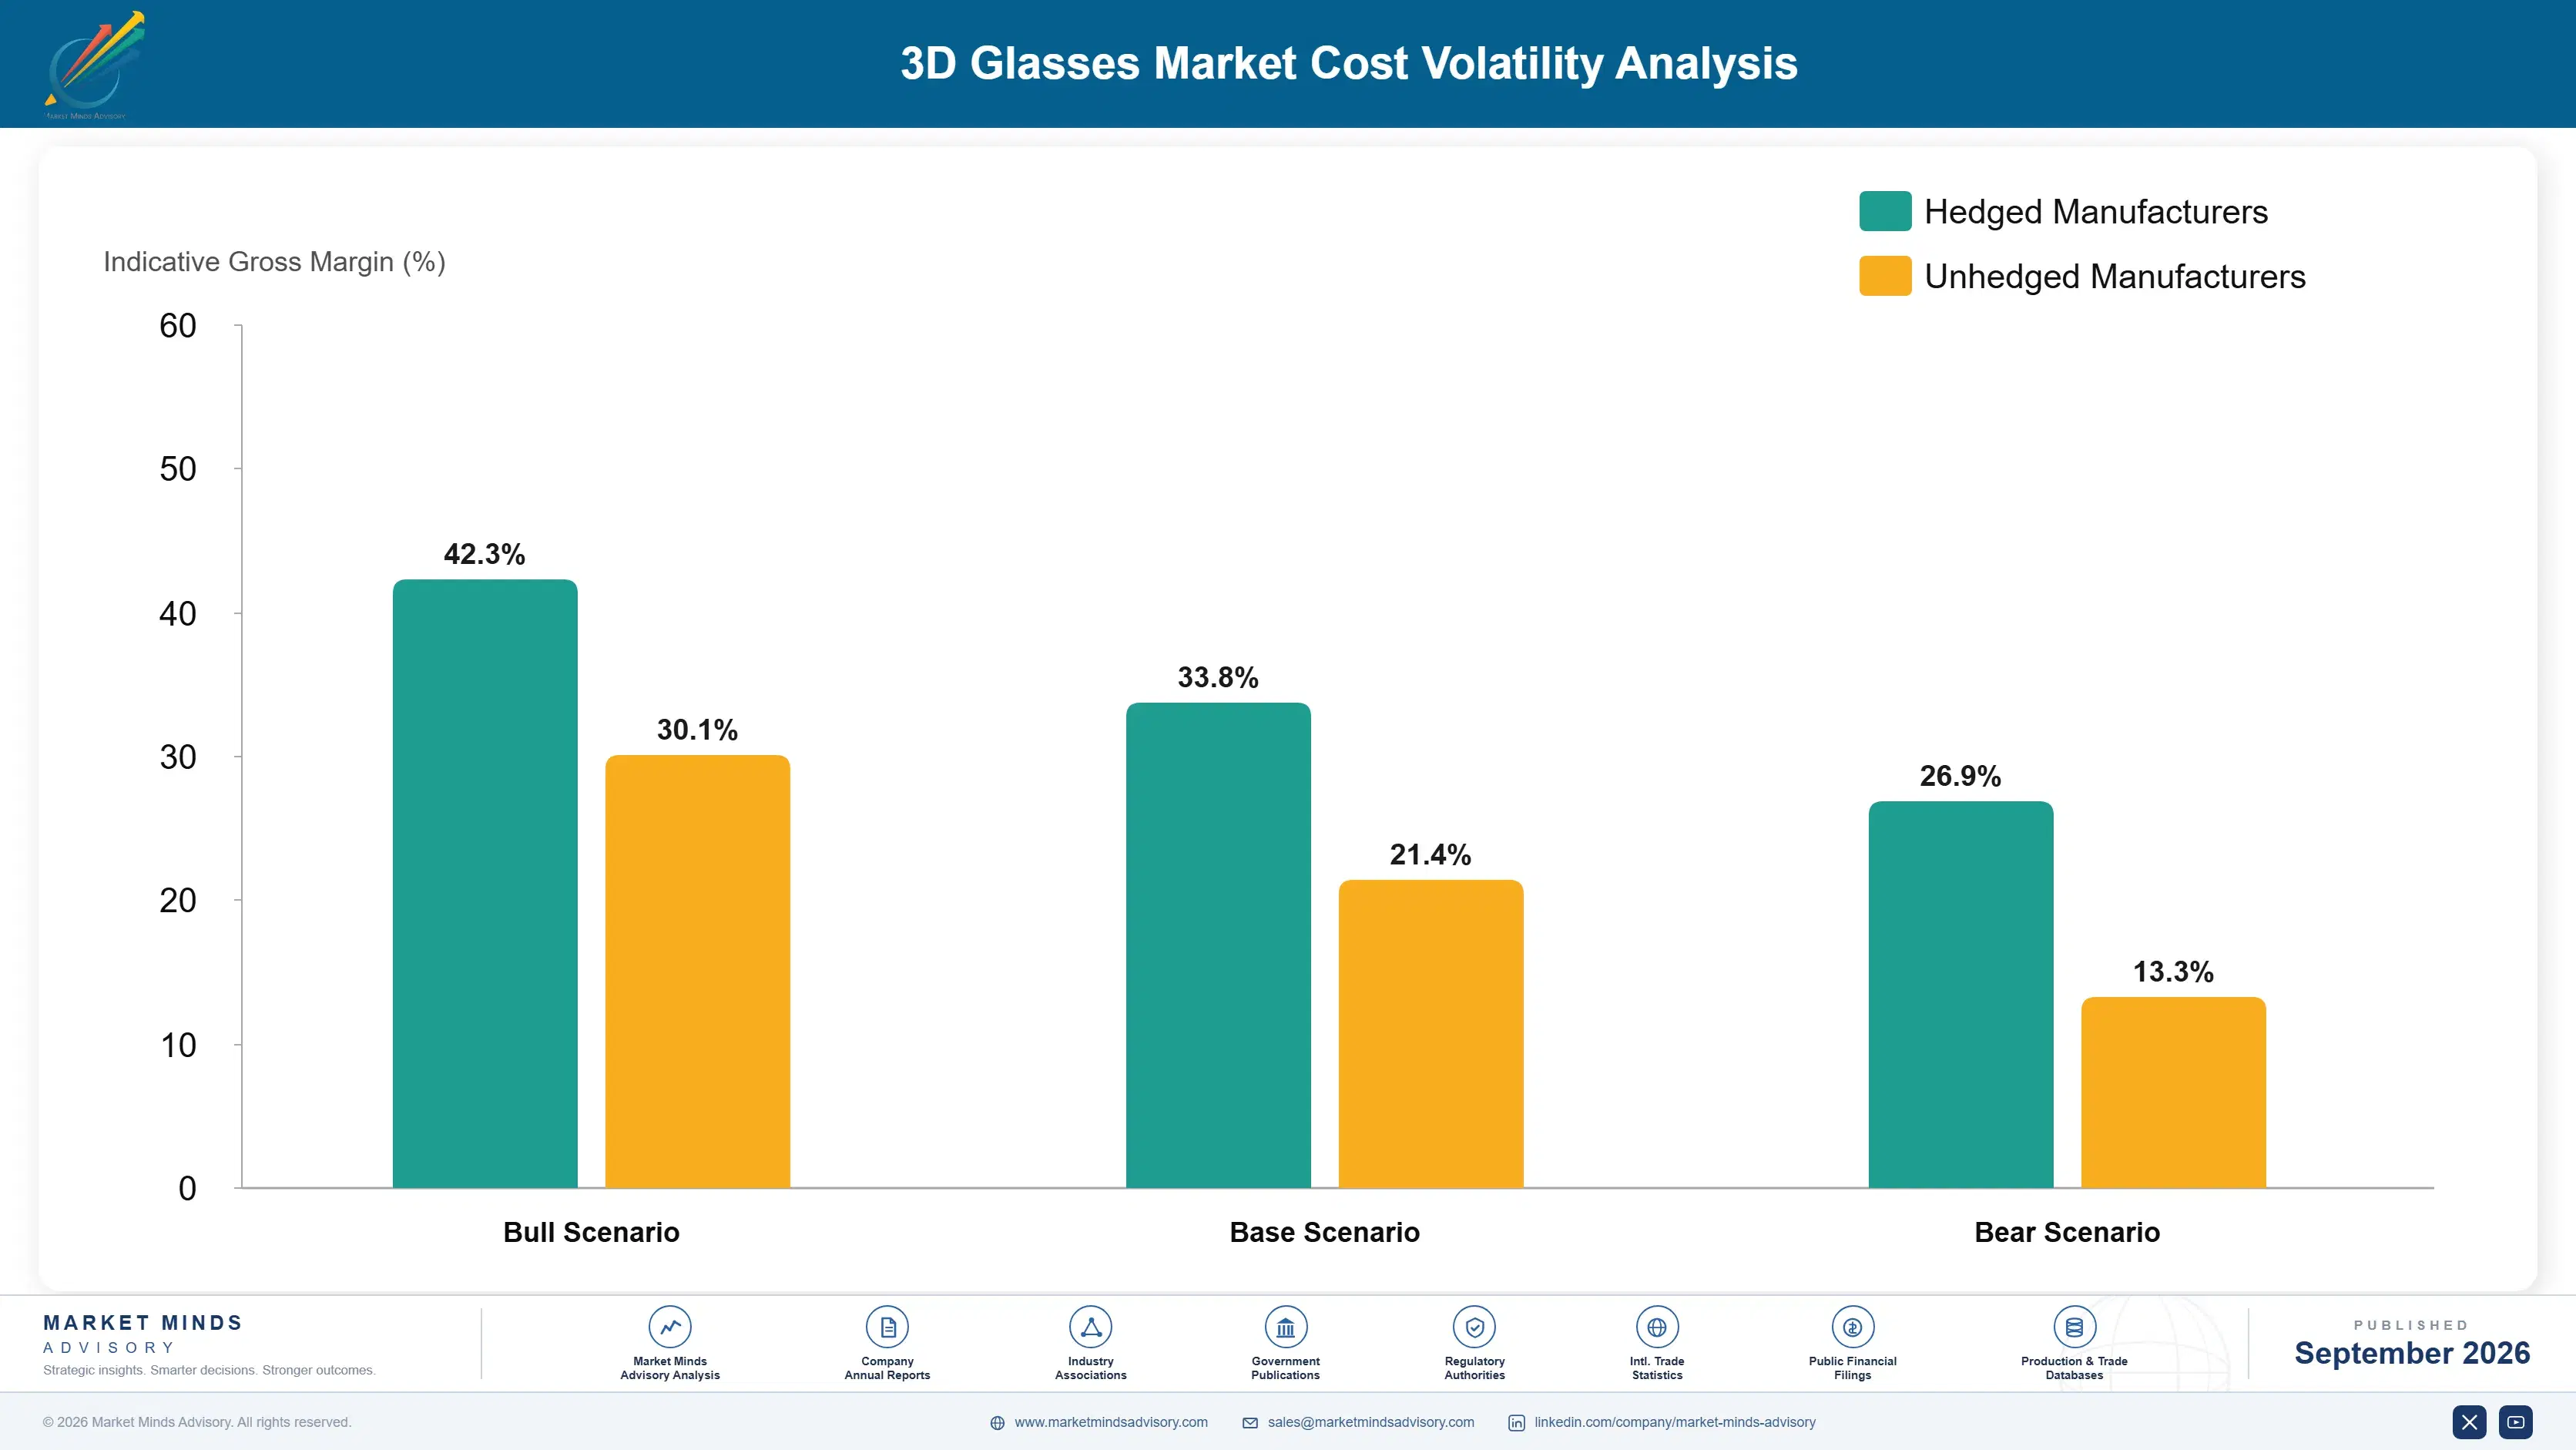
Polarising film and optical coating account for roughly 33% of passive eyewear cost, supplied by a small group of specialist film producers concentrated in Japan and Taiwan. Injection moulded frame material takes around 27%, with polycarbonate and polypropylene pricing tracking petrochemical feedstock closely. Assembly labour absorbs about 22%, and packaging with distribution takes most of the remaining balance across high unit volumes.
Polycarbonate and polypropylene pricing moved sharply through 2022 as European energy costs fed into petrochemical production, and eyewear manufacturers on annual venue contracts absorbed much of that movement rather than repricing mid-term. Barco Annual Report 2023 and Dolby Laboratories Annual Report 2023 both record component and material cost pressure across display product lines during the same period. Contracted resin supply managed the volatility considerably better than spot purchasing did.

The competitive disadvantage mechanism is resin contracting rather than optical film access. A manufacturer holding contracted polymer supply can quote venue pricing across a full contract year, while one buying on spot terms cannot hold a price at 0.9 dollars per unit through any material move. Exposure concentrates among smaller manufacturers without the volume to contract, which is a barrier that has nothing to do with optical capability.
3d-glasses-market-cost-volatility-analysis-1789994937488

Contract Polymer Resin Across Full Venue Years

Frame material runs around 27% of passive eyewear cost and polymer pricing tracks petrochemical feedstock, which moves considerably more than venue contract terms allow for. Contracting resin across the full venue contract year removes exposure on a product already priced near 0.9 dollars per unit. Manufacturers buying on spot terms cannot hold quoted pricing through any material move at all.

Qualify Second Optical Film Sources Early

Polarising film and coating account for roughly 33% of passive eyewear cost and come from a small group of specialist producers concentrated in two countries. Qualifying an alternative source costs engineering time against no immediate return and preserves supply when the primary tightens. Manufacturers discovering during a shortage that nothing else is qualified have already lost the venue contract entirely.

Design Frames For Cleaning Cycle Survival

Handling rather than optics destroys venue stock, with roughly 7% lost or broken each quarter and processing costing 11 cents per cycle. Frame geometry that survives repeated automated cleaning reduces replacement volume the operator has to fund. That engineering investment sells directly against the operator's actual cost model rather than against any optical specification comparison.

Portfolio Architecture for Margin Defence

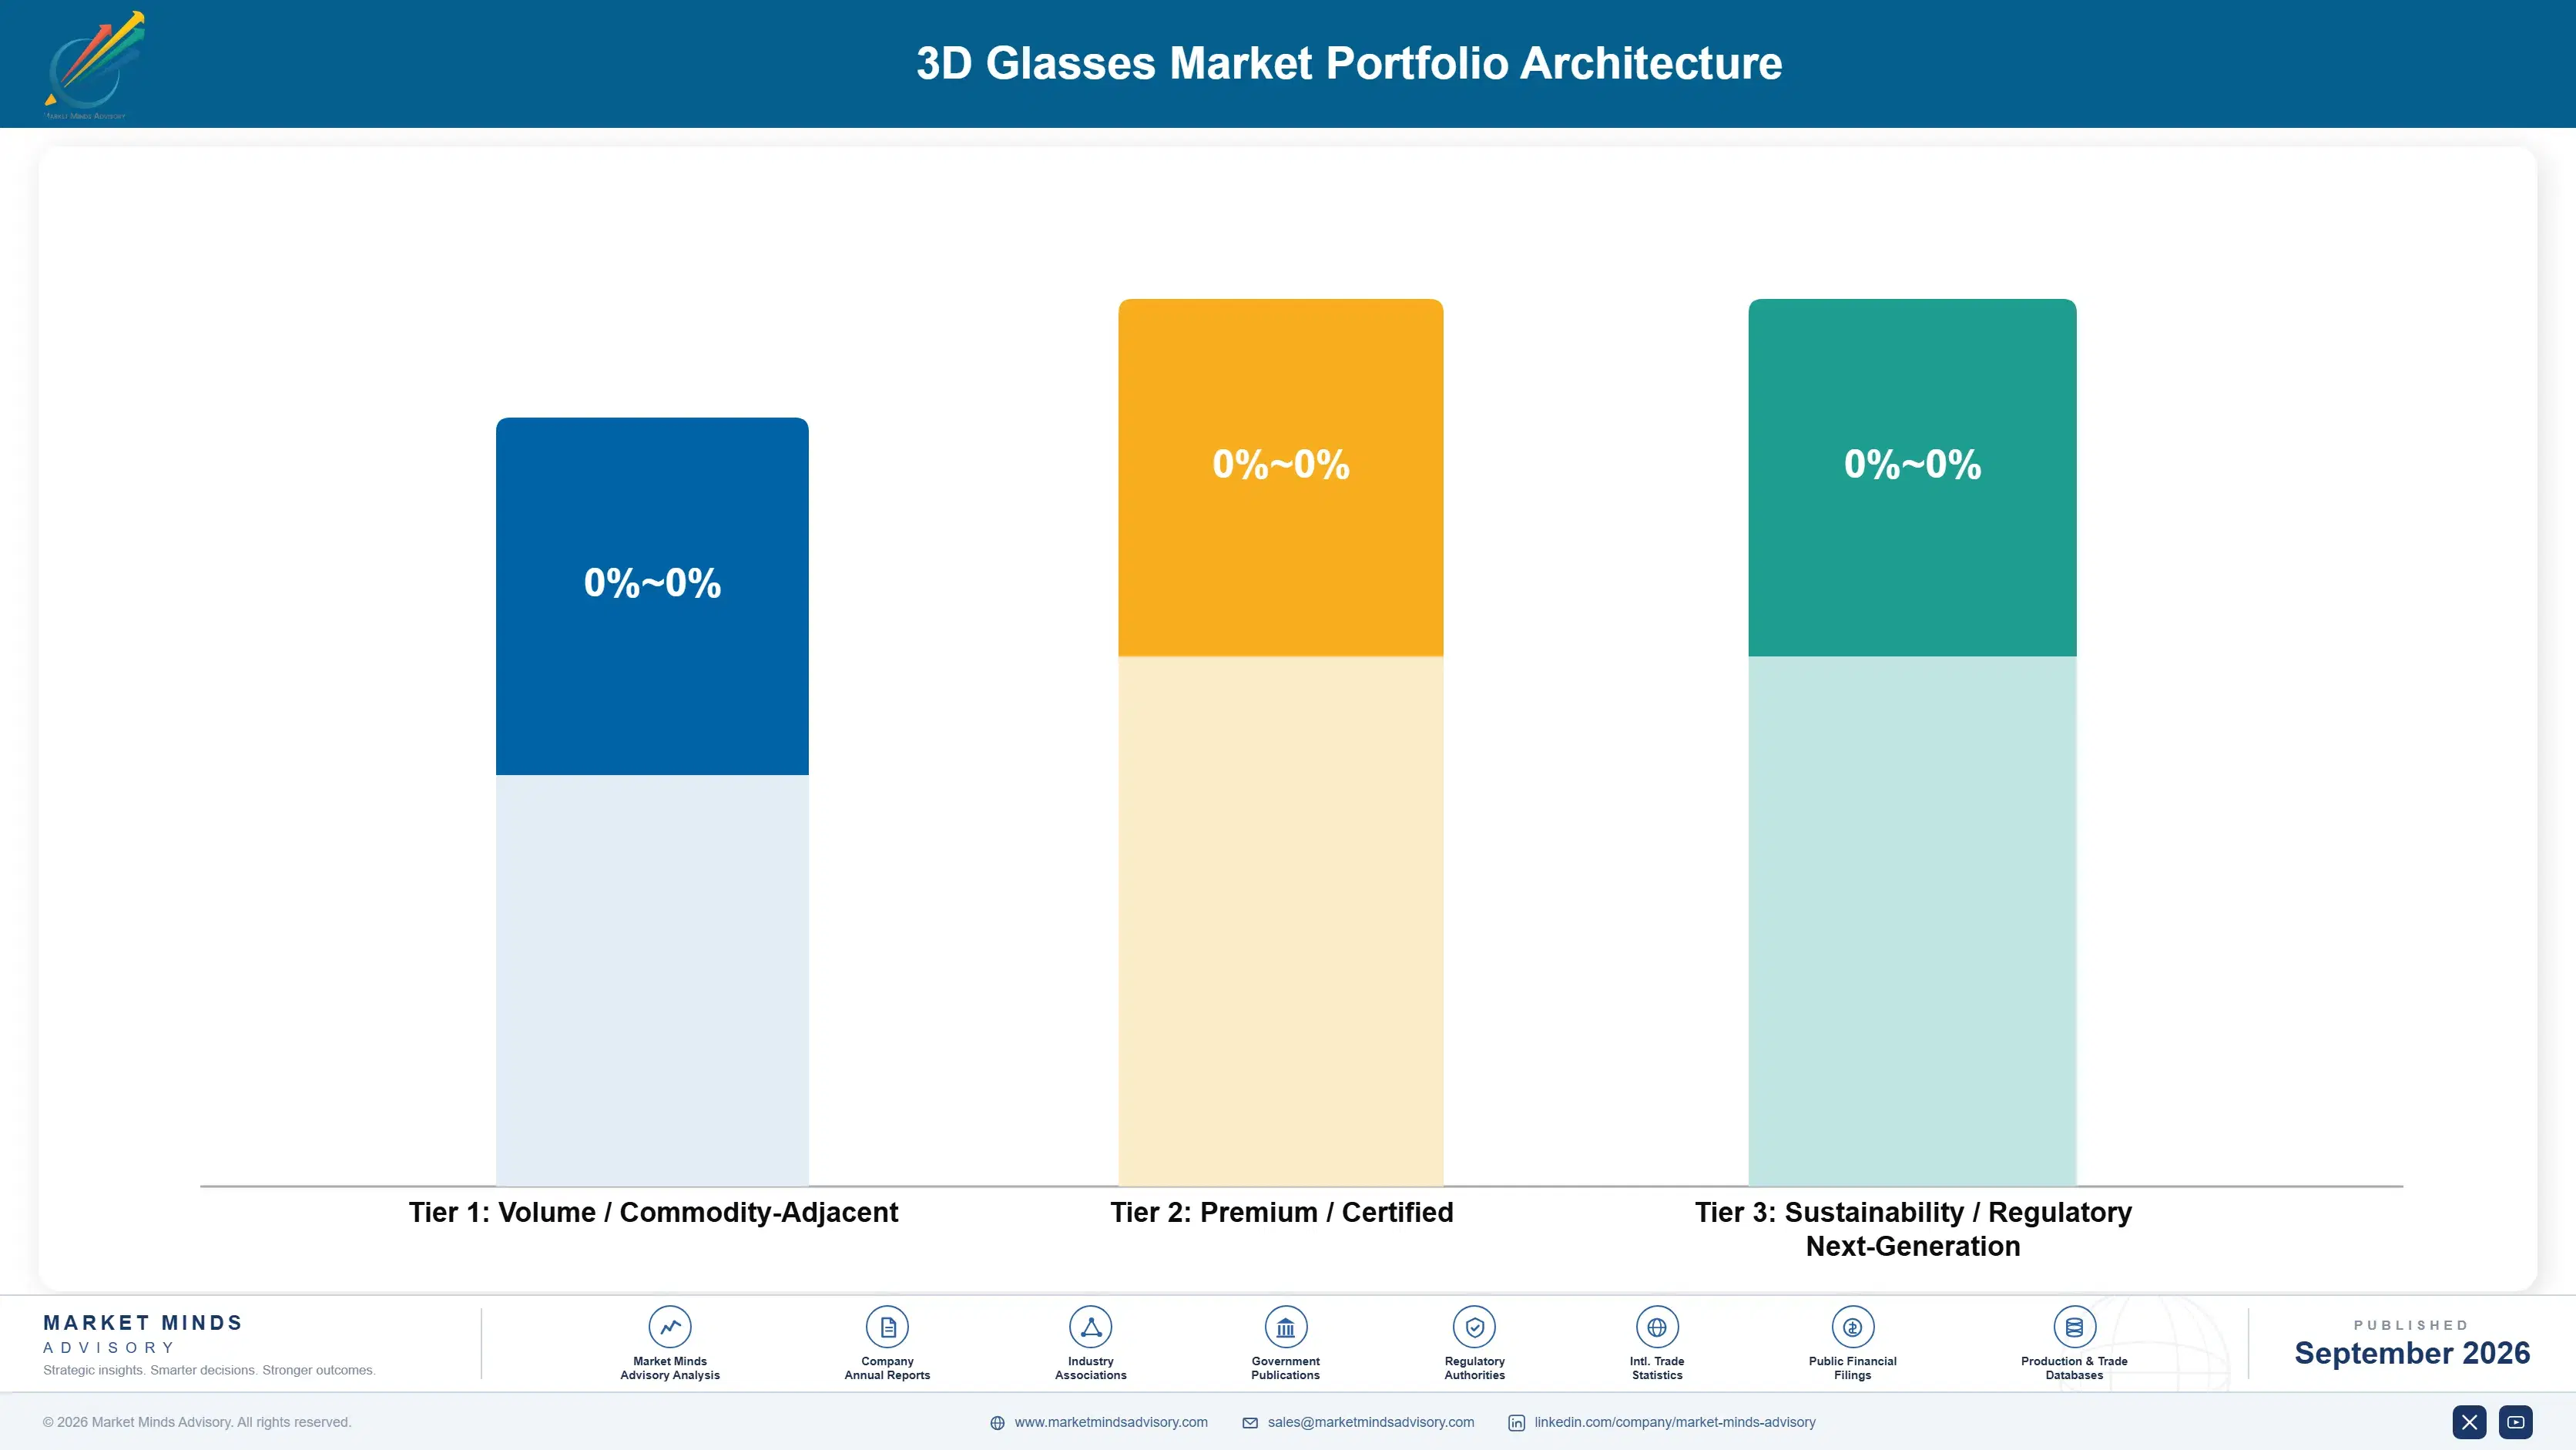
Margin architecture separates on whether the product is a consumable or a qualified component. Anaglyph and basic filter glasses earn least, since they are close to printed card and anybody can make them. Passive polarised venue eyewear sits above on optical film content. Active shutter simulation eyewear, medical-approved stereo lenses and integrated cleaning systems earn most, because each is either electronically complex or documented inside an approved system.
The volume versus premium tension runs between venue consumables and professional equipment, and the two barely share a customer. Venue eyewear moves enormous unit volume at thin margin against handling economics. Simulation and medical eyewear moves tiny volume at strong margin against approval status. Suppliers running both through one commercial organisation consistently starve whichever is smaller, which is usually the professional side.

High-value pools concentrate in active shutter simulation eyewear and in integrated cleaning systems, neither of which is reached through eyewear manufacturing capability alone. Simulation requires synchronisation engineering and defence procurement patience. Cleaning systems require understanding venue operations rather than optics. Both demand capabilities that a manufacturer of polarised lenses does not automatically possess or easily acquire.

Volume / Commodity-Adjacent

Anaglyph and basic filter glasses and single-use passive eyewear, competing purely on unit cost at very high volume. The ten point spread separates manufacturers holding contracted polymer resin supply from those exposed to spot pricing across their entire order book.
Gross Margin: 12% to 22%

Premium / Certified

Reusable passive polarised venue eyewear and prescription-compatible clip-on lenses, where optical film content and frame durability determine selection. The twelve point spread tracks how much of a supplier's volume sits under multi-year venue contracts rather than in transactional replacement ordering.
Gross Margin: 28% to 40%

Sustainability / Regulatory / Next-Generation

Active shutter simulation eyewear, medical-approved stereo lenses and integrated cleaning systems, where electronics, approval status or operational integration determine value. The sixteen point spread reflects how much is engineered rather than assembled from common parts.
Gross Margin: 46% to 62%
3d-glasses-market-portfolio-architecture-1789994937985

High-value Sub-segments and Strategic Watch-out

Active Shutter Glasses For Simulation And Training

Grows at 6.9% wherever synchronised stereo presentation is a genuine technical requirement rather than any kind of presentation preference. The sixteen point spread here reflects synchronisation engineering content. At around 58 dollars per pair the unit cost is entirely negligible against the simulator it serves.
Gross Margin: 46% to 62%

Reusable Venue Eyewear With Cleaning Systems

Grows at 5.8% as attraction operators buy the whole handling operation rather than just the optical product on its own. The twelve point spread here reflects venue contract coverage. Processing costs 11 cents per cycle, which exceeds the purchase price within months of any deployment.
Gross Margin: 28% to 40%

Interference Filter And Spectral Separation Glasses

Grows at 4.9% across those venues where projection arrangements or screen surfaces make polarisation separation genuinely impractical to deploy properly. The twelve point spread here reflects optical coating content. Higher unit cost restricts it to those venues holding a genuine technical reason for choosing it.
Gross Margin: 28% to 40%

Anaglyph And Filter Glasses

Grows at 1.8%, slowest of the six optical classes, on a product close enough to printed card that essentially anybody at all can manufacture it. The ten point spread here reflects polymer resin contracting. Promotional and educational use keeps a modest volume moving through each year.
Gross Margin: 12% to 22%

Why Venue Choices Stick

The annuity here runs on consumption rather than contract. A venue equipping thousands of guests a day loses or breaks around 7% of stock every quarter and replaces reusable pairs on roughly 14 month cycles, so the supplier selected once keeps shipping continuously. That recurring volume is worth far more than the initial order. Operators change supplier when handling economics change, not when a contract expires.
Stickiness varies sharply by application and by what surrounds the eyewear. Simulation and medical eyewear is the most entrenched, since the part is documented inside an approved system and changing it means revisiting that approval. Eyewear matched to a specific projection and polarisation arrangement is similarly fixed. Generic venue eyewear bought purely on cost per cycle is barely sticky at all, and operators switch on a price move without deliberation.

The buyer sits in venue operations rather than any technical function, and has done for longer than most suppliers acknowledge. An operations manager evaluates cost per guest processed, cleaning throughput and how much stock disappears each quarter. Nobody at a theme park is assessing optical separation quality. Suppliers whose commercial material still leads with image performance are addressing a conversation that ended years ago.
3d-glasses-market-end-use-penetration-index-1789994938477

What Decides Eyewear Orders

These are among the four positions where our research anticipates prominent divergence between winners and laggards over the coming forecast period. Each is grounded in the demand model, the regulatory perimeter, and the announced capacity pipeline.
01 / HANDLING ECONOMICS POSITIONING

Compete On Cost Per Guest Processed

A reusable pair costs around 0.9 dollars while processing it between guests costs about 11 cents on every single cycle, so the recurring handling cost overtakes the purchase price within months of deployment at any realistic venue throughput level. Operators run this entirely as a labour and consumables problem and evaluate their suppliers on exactly that basis. Suppliers offering faster cleaning throughput or genuinely more durable frames are competing on the one number that the operator actually manages every single day.
02 / NEW VENUE COVERAGE

Reach Attractions During Fit-Out

A newly built attraction equips its entire daily audience from opening day rather than replacing any existing stock, which is a fundamentally different kind of purchase from a replacement order at a venue that is already running. The United Arab Emirates compounds at 8.2% annually, and Gulf and Asian construction programmes keep adding further sites at pace. Reaching those projects means engaging attraction designers and construction programmes rather than venue operations teams, since the eyewear specification settles during fit-out rather than afterwards.
03 / PROFESSIONAL CHANNEL SEPARATION

Run Simulation Sales As Its Own Business

Active shutter eyewear at around 58 dollars per pair sells into flight, driving and defence simulators where synchronised stereo is a genuine technical requirement and the unit cost is negligible against the training programme behind it. That is a genuinely different business from venue eyewear in volume, buyer, approval process and in sales cycle length alike. Suppliers running both of these through a single commercial organisation consistently starve whichever of the two happens to be the smaller one for them.
04 / THROUGHPUT DEFENCE ARGUMENT

Answer Headsets With Guests Per Hour

Head-mounted displays keep on getting steadily lighter and cheaper, and an attraction operator switching across to them removes that venue's entire eyewear consumption in one decision that nobody gets to revisit. The defensible ground here is guest throughput, since a headset takes considerably longer to fit, adjust and clean per guest than a pair of glasses ever does. Suppliers quantifying that difference in guests processed per hour are arguing entirely on the operator's own commercial terms rather than on product ground.

Engagement Snapshot From the Field

A live engagement with an industry participant carrying material or product regulatory and market exposure ahead of a defining policy shift, showing how our research translates into a defensible multi-year portfolio strategy.
MARKET MINDS ADVISORY · CLIENT ENGAGEMENT SUMMARY
3D Glasses Producer Strategic Portfolio Review and Transition Roadmap 2026·Investment Scenario on 3D Glasses Exposure Evaluation 2025-26
CLIENT PROFILE
A location-based entertainment operator running nine venues across three countries, with stereo attractions at seven of them and eyewear purchased separately at each site by local management. Nobody had ever consolidated what the eyewear programme actually cost across the group, and quarterly loss rates varied enormously between venues without anyone establishing why that was happening.
STRATEGIC CHALLENGE
Group procurement wanted a single supplier agreement to cut unit pricing, which looked entirely sensible on the face of it. Venue managers resisted, citing handling differences that nobody had ever quantified. Meanwhile two venues were evaluating head-mounted displays as a replacement, on grounds that had never once been tested against measured guest throughput.
MMA APPROACH
MMA measured total eyewear cost per guest across all seven stereo venues, separating purchase price from cleaning labour, consumables and loss replacement. We established why loss rates differed between sites, and modelled headset substitution against measured guest throughput at the two venues considering it. Work drew on 47 expert interviews conducted in Q4 2025 with operators and eyewear suppliers.
KEY FINDINGS
  1. Purchase price accounted for under 3 in 10 of total eyewear cost per guest, with cleaning labour and loss replacement making up the remainder entirely.
  2. Loss rates ranged from around 4% to above 11% quarterly between venues, driven by collection point placement rather than by any difference in guest behaviour.
  3. Headset substitution reduced guest throughput enough at both venues to cost more in lost capacity than the eyewear programme did (client-reported, unverified by MMA).
  4. Three of the nine venues were buying eyewear that did not survive their own automated cleaning equipment, which explained most of the loss rate variance.
CLIENT PROFILE
A location-based entertainment operator running nine venues across three countries, with stereo attractions at seven of them and eyewear purchased separately at each site by local management. Nobody had ever consolidated what the eyewear programme actually cost across the group, and quarterly loss rates varied enormously between venues without anyone establishing why that was happening.
STRATEGIC CHALLENGE
Group procurement wanted a single supplier agreement to cut unit pricing, which looked entirely sensible on the face of it. Venue managers resisted, citing handling differences that nobody had ever quantified. Meanwhile two venues were evaluating head-mounted displays as a replacement, on grounds that had never once been tested against measured guest throughput.
MMA APPROACH
MMA measured total eyewear cost per guest across all seven stereo venues, separating purchase price from cleaning labour, consumables and loss replacement. We established why loss rates differed between sites, and modelled headset substitution against measured guest throughput at the two venues considering it. Work drew on 47 expert interviews conducted in Q4 2025 with operators and eyewear suppliers.
KEY FINDINGS
  1. Purchase price accounted for under 3 in 10 of total eyewear cost per guest, with cleaning labour and loss replacement making up the remainder entirely.
  2. Loss rates ranged from around 4% to above 11% quarterly between venues, driven by collection point placement rather than by any difference in guest behaviour.
  3. Headset substitution reduced guest throughput enough at both venues to cost more in lost capacity than the eyewear programme did (client-reported, unverified by MMA).
  4. Three of the nine venues were buying eyewear that did not survive their own automated cleaning equipment, which explained most of the loss rate variance.
RECOMMENDED STRATEGY
Phase 1: Phase one: negotiate on total cost per guest processed rather than on unit price, since purchase price was under a third of the real cost. Phase 2: Phase two: standardise collection point placement across venues, which explained more of the loss rate variance than anything supplier related did. Phase 3: Phase three: drop headset substitution at both venues, since the throughput cost exceeded the entire eyewear programme by a clear margin.
OUTCOME
The operator negotiated group supply on total cost per guest and standardised handling procedures across all nine sites (client-reported, unverified by MMA). Loss rates converged toward the best-performing venues within two quarters. Eyewear is now managed as an operating process rather than as a purchasing line, which is the change that outlasted the engagement.

Frequently Asked Questions

Foundational context covering the market sizes, CAGR, scope, country, region and competition that inform every finding below. This section is provided to cover basics and most often pre-purchase conversations, answered from the MMA Primary Research Dataset.

What is the current size of the 3D Glasses Market?

Global value reaches USD 1.5 billion in 2026, measured as stereoscopic eyewear shipment revenue across six optical classes. The 2025 base for the market is USD 1.4 billion.

How large will the 3D Glasses Market be by 2036?

The market reaches USD 2.3 billion by 2036, an increase of USD 0.8 billion across the forecast period. That represents 1.53 times expansion from the 2026 base.

What is the CAGR for the 3D Glasses Market 2026 to 2036?

The base case runs at 4.6% annually, with a bull case at 5.8% if Gulf and Asian attraction construction runs ahead of schedule and a bear case at 3.4% if headsets displace venue eyewear.

Which segment is growing fastest?

Active shutter glasses for simulation and training grow at 6.9%, half again the market rate of 4.6%. Those applications need synchronised stereo that passive filter separation cannot deliver.

Who are the major companies in the 3D Glasses Market?

RealD, Volfoni, XPAND 3D, Depth Q and Marchon Eyewear lead on eyewear shipment revenue, together holding 49%. Barco, Christie Digital Systems and Optoma hold smaller adjacent positions.

Which country is growing fastest?

The United Arab Emirates leads at 8.2%, on attraction construction funded as tourism infrastructure rather than as any commercial return calculation. Saudi Arabia and India follow behind.

Report Segmentation Architecture

The full report scope spans multiple orthogonal segmentation dimensions, with cross-tabulated demand data provided for each dimension pair. Coverage extends further to regional breakdowns, trend trajectories, and the competitive detail needed to support segment-level decision-making.

By Optical Class

  • Active Shutter Glasses For Simulation And Training
  • Reusable Venue Eyewear With Cleaning Systems
  • Interference Filter And Spectral Separation Glasses
  • Passive Polarised Glasses
  • Prescription-Compatible Clip-On Stereo Lenses
  • Anaglyph And Filter Glasses

By End-Use Industry

  • Theme Parks And Location-Based Attractions
  • Flight And Driving Simulation
  • Defence And Military Training
  • Medical And Surgical Visualisation
  • Design And Engineering Visualisation
  • Cinema And Exhibition Venues

By Commercial Dimension

  • Direct Venue Operator Supply
  • Attraction Fit-Out Specification
  • Defence And Aviation Procurement
  • Medical System Integration
  • Distributor And Reseller Channel
  • Single-Use Consumable Supply

By Region

  • North America
  • Western Europe
  • East Asia
  • South Asia and Pacific
  • Latin America
  • Middle East and Africa
  • Eastern Europe

Scope, Methodology, and Coverage

Every figure in this report is reproducible from documented input assumptions. The scope below maps the historical period, the forecast horizon, the segmentation dimensions, and the countries covered, alongside the underlying primary and qualitative methodology.
Historical Period
2020 to 2025
Forecast Period
2026 to 2036
Base Year
2025 (USD billions; MMA Primary Research Dataset, September 2026)
Market Definition
This report covers stereoscopic viewing eyewear by optical class: passive polarised glasses, active shutter glasses for simulation and training, anaglyph and filter glasses, interference filter and spectral separation glasses, prescription-compatible clip-on stereo lenses, and reusable venue eyewear with cleaning and handling systems. It excludes augmented and virtual reality headsets, autostereoscopic displays requiring no eyewear, projection and display hardware, light engines, and content production or conversion services.
Quantitative Units
USD millions, eyewear shipment revenue basis; shipped units; cost per pair in dollars; cleaning cost per cycle in cents; quarterly loss rates as a percentage; venue replacement cycles in months.
Segmentation Dimensions
Optical class; end-use application setting; commercial procurement route; geography across seven regions.
Regions Covered
North America, Western Europe, East Asia, South Asia and Pacific, Latin America, Middle East and Africa, Eastern Europe
Countries Covered
China, Japan, South Korea, Taiwan, India, Singapore, Australia, United States, Canada, Mexico, Brazil, Argentina, United Kingdom, France, Germany, Spain, Netherlands, Poland, United Arab Emirates, Saudi Arabia.
Key Companies Profiled
RealD, Volfoni, XPAND 3D, Depth Q, Marchon Eyewear, Barco, Christie Digital Systems, Dolby Laboratories, MasterImage 3D, Sharp NEC Display Solutions, Optoma, Epson, Panasonic Connect, Cinemeccanica, IMAX Corporation.
Quantitative Methodology
Primary survey, n=3,800 respondents, Q4 2025, six countries; demand-side model with trade association cross-validation
Qualitative Methodology
47 expert interviews, Q4 2025; applied to validate demand model assumptions, identify emerging dynamics, and assess competitive positioning
Report Format
PDF and XLSX data workbook (Word format preview document)
Publisher
Market Minds Advisory
Report Code
MMA-2026-TEC-711
Published
September 2026
Contact
sales@marketmindsadvisory.com | www.marketmindsadvisory.com

Purchase the full 3D Glasses Market Report (2026 to 2036).

This report sizes the global 3D glasses market from 2026 to 2036 across six optical classes, six application settings and seven regions. It explains what survived the retreat of consumer stereo presentation and why the remaining applications share one characteristic: the viewer is not asked whether they would rather not wear the glasses. Handling economics are quantified at 11 cents per cleaning cycle against a 0.9 dollar unit price, with quarterly loss rates near 7% examined as the real operating variable. Cost composition is sourced to company annual reports. Regional analysis explains why East Asia leads at 31% of unit volume.
Six optical classes sized through to 2036
Handling economics quantified against unit purchase price
Headset substitution risk assessed on guest throughput
Twenty named suppliers assessed on eyewear revenue
Four revenue levers with quantified commercial impact
Anonymised entertainment operator cost engagement documented in full

Built For The People Who Decide

From boardroom strategy to bench-side execution, this report is read cover-to-cover by leaders shaping the next decade of their industry, turning demand scenarios, market dynamics and valuation benchmarks into decisions.
CXOs/ Presidents/ VPs/ Managers
M&A and Corporate Development
Strategy Teams and R&D Heads
Procurement and Product Directors
Regulatory and Compliance Leaders
Investor Relations and Equity Analysts